

My trade of the week 17/2024 $LI ABCD trend continuation
My trade of the week 17/2024 $LI ABCD trend continuation
When the charts are aligned


How I set the bias
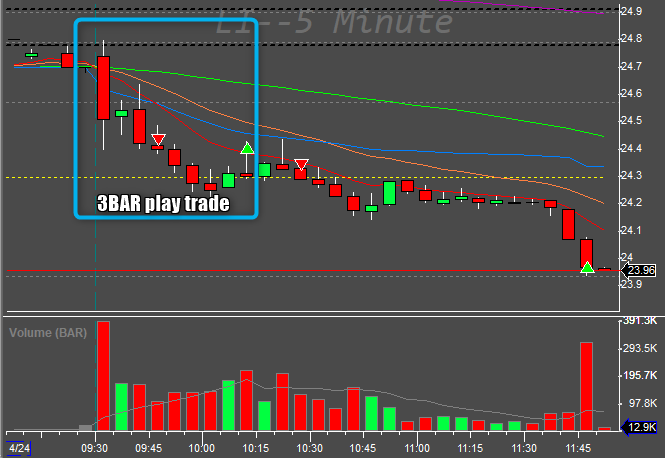
LI 0.00%↑ was on a downtrend on the daily chart, denying a pullback a day ago, creating a reverse hammer candle and opened below that candle today.

I expected a retest of the low of 22nd of April. I took the 3BAR play trade on the 5-min chart but after reaching nearly my 2R goal it stopped me out at break-even as per my trade management rules which was an unfortunate stop, but that is the way it sometimes turns out to be. I continued to watch the stock for a possible LOD break or trend continuation pattern (ABCD)
What is interesting to see here is the trap for the ABCD traders which is quite obvious
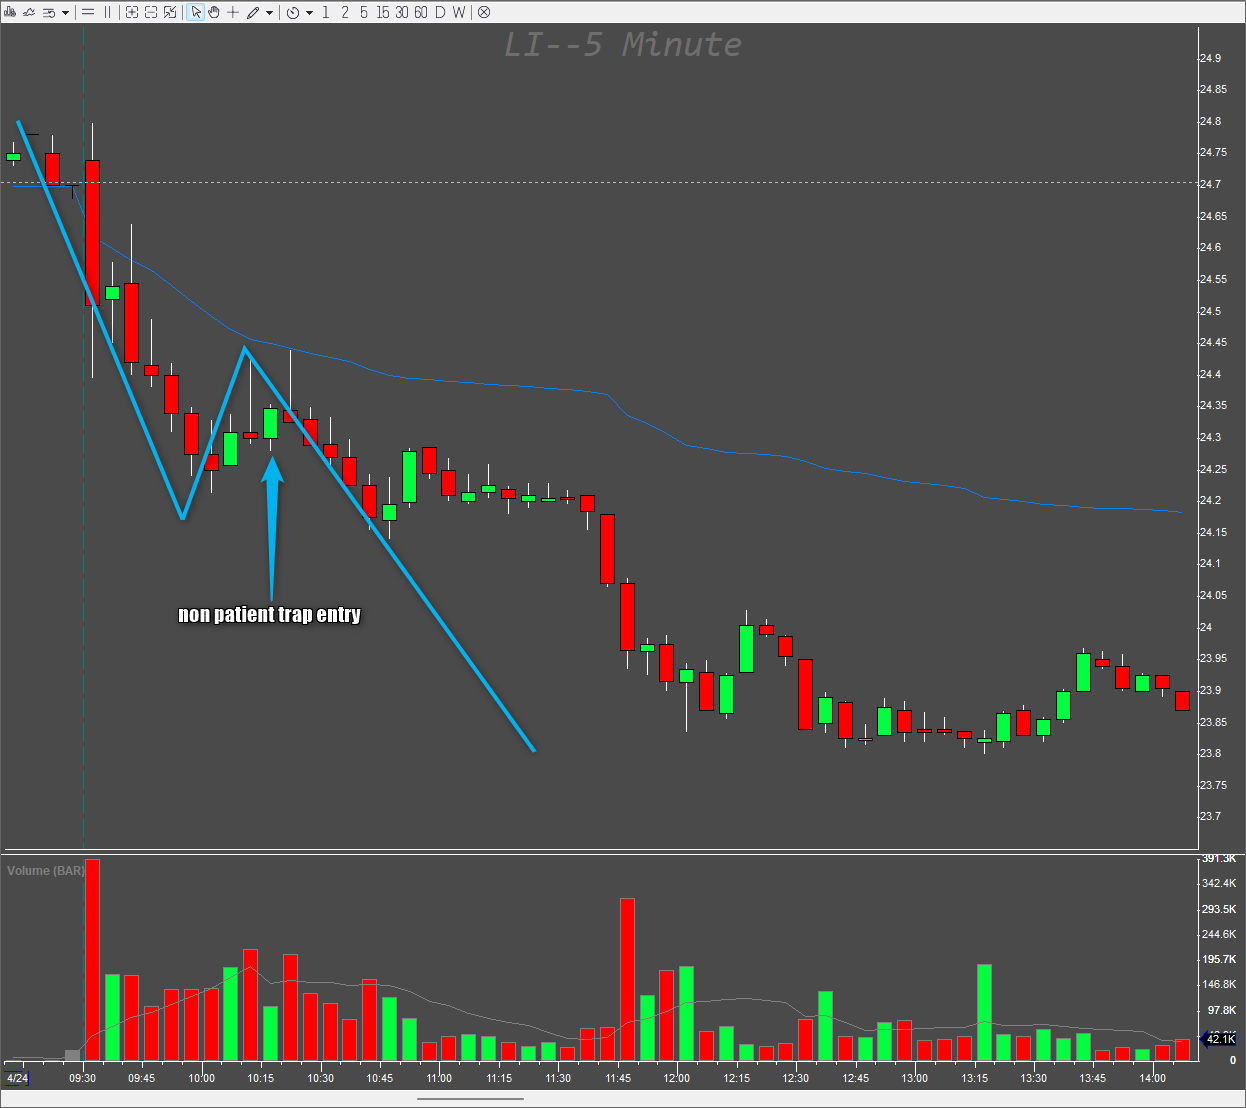
The reasons to avoid the trap.
the pullback was only 2 candles and I like them to be more
the entry candle was going red, and I like to enter using the overlap method, meaning that for a nice trend continuation I expect first an overlap to be created first. That means the 1st or 2nd candle of the 5-min cycle needs to be green before the 5-min candle turns red.
I like the double top/bottom ABCDs around 10:20 AM most. I call them C1-C2 ABCDs as they create 2 C points.

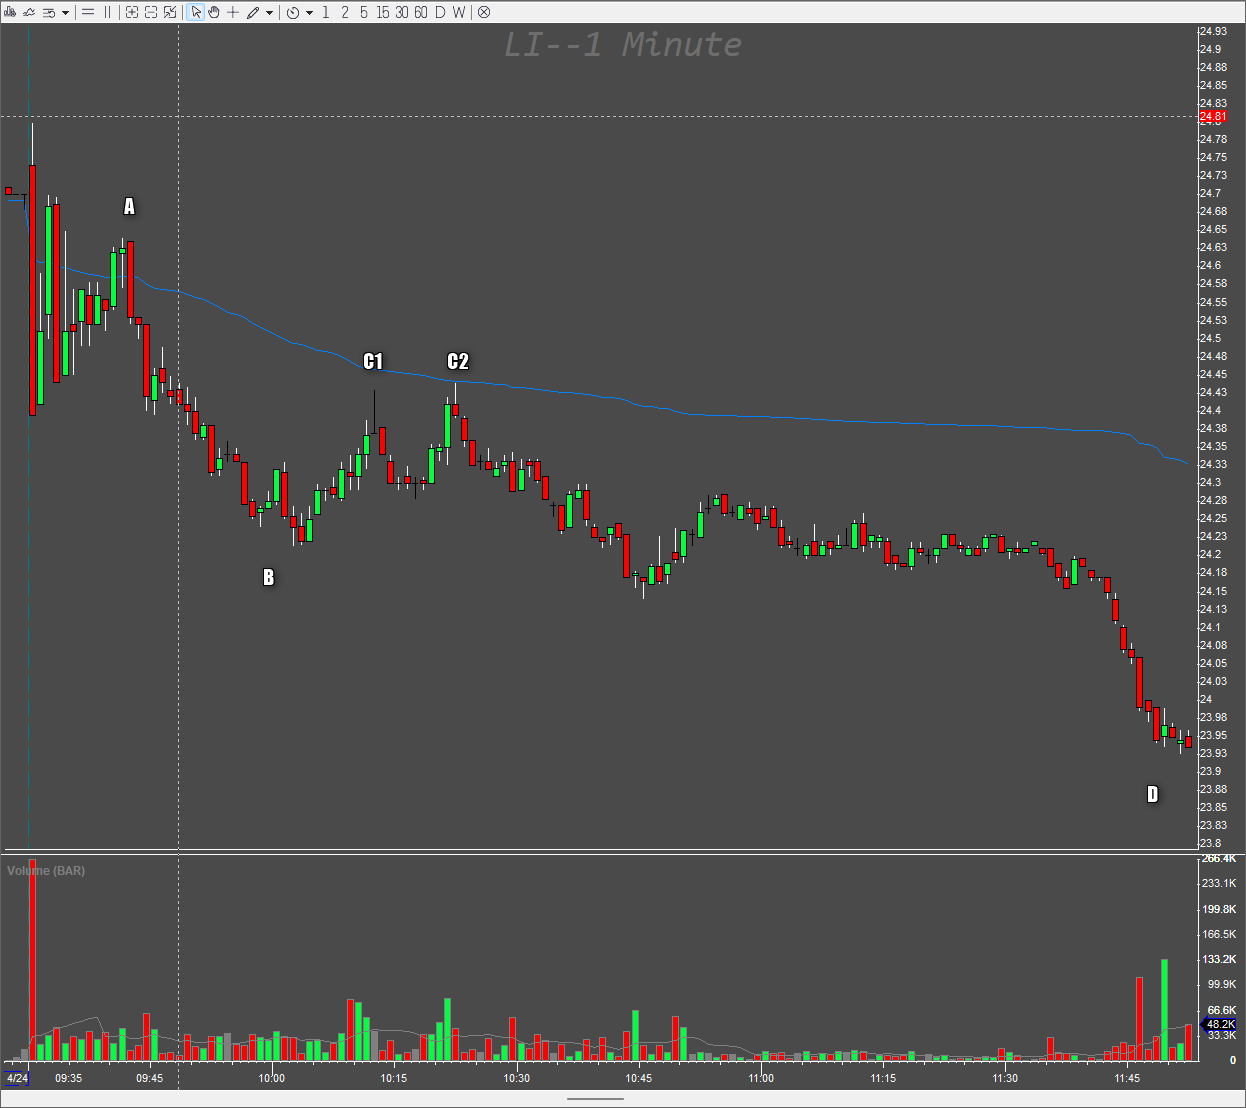
Entry rules
I use the pivot candle high as stop and enter on the previous candle break. Depending on the chart I am looking at for the entry.
5-min chart entry

1-min chart entry

Sometimes the 1-min chart entry is not so nice and clear, as in this case the volume build up towards VWAP was about to be a concern.
I checked the ATR using my hotkey quickly and saw the potential for today to go below $24.00
Trade management
For ABCDs, it is very often that my entry is being re-tested, so I usually use 2R all-out strategy and I either hit a full stop or a 2R win. In this case I targeted 3R because I have only 3R and 5R range hotkeys programmed and, as mentioned above, I saw the potential for a 24 and below move.
