
Candles overlap methods
How to improve your entries and not to get tricked into fake moves

What is the overlap?
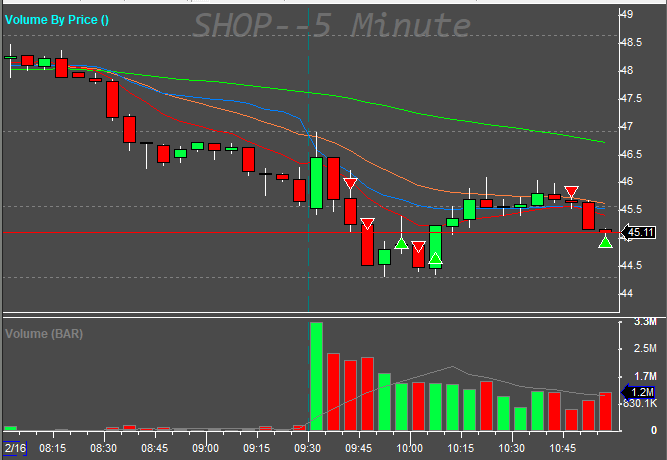
Everybody likes a nice trending chart like this
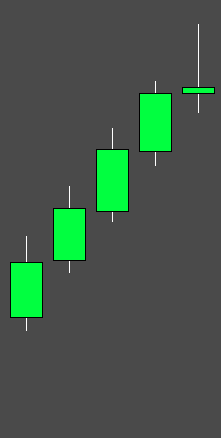
It is a 5-minute candles chart. The bottom shadows of the candles are the overlap area.
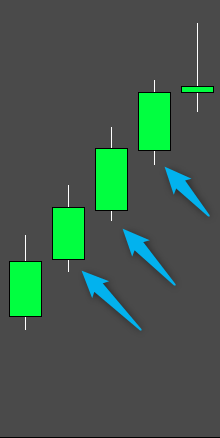
We can say that each of the 5-minute cycle started with a small pullback before breaking up the previous candle high.
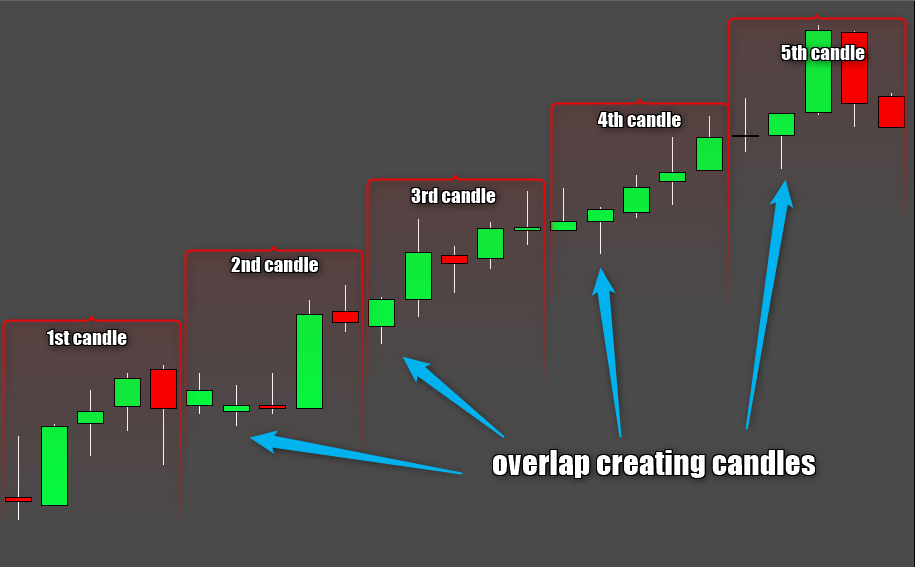
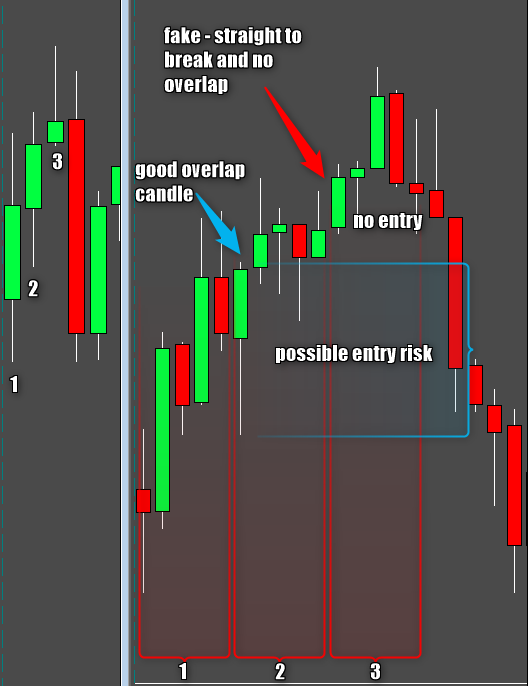
If we look at the 1-min chart, we can see how the overlaps (or shadows) are created.
How to use it for our entries
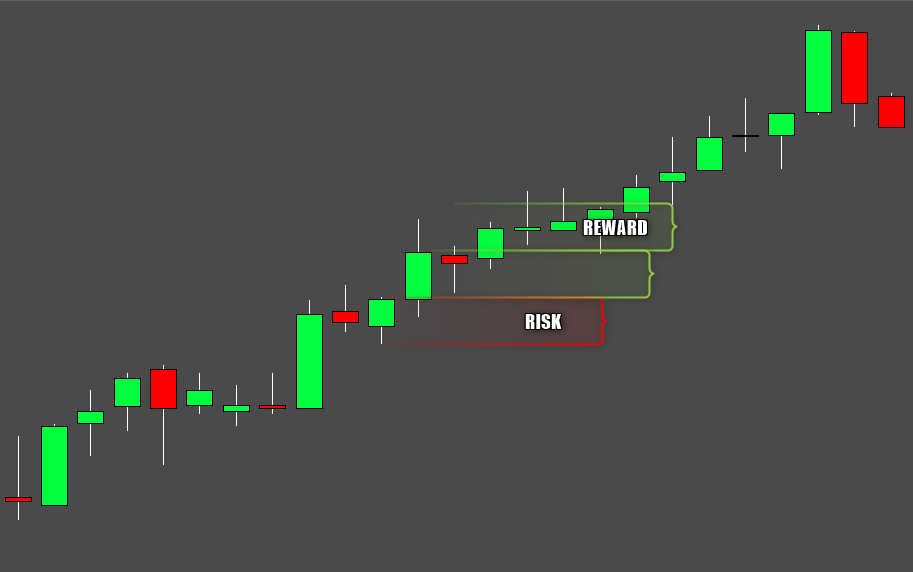
Based on the pictures above, we can say a few important things if we are looking for an entry to catch the trend.
The overlap always happens in 1st or 2nd 1 min candle
The price never goes below the overlap creating candle
The overlap happens in every 5-min candle
The break-up happens in 3rd or 4th candle
Based on that, we can see several possible trades on the chart
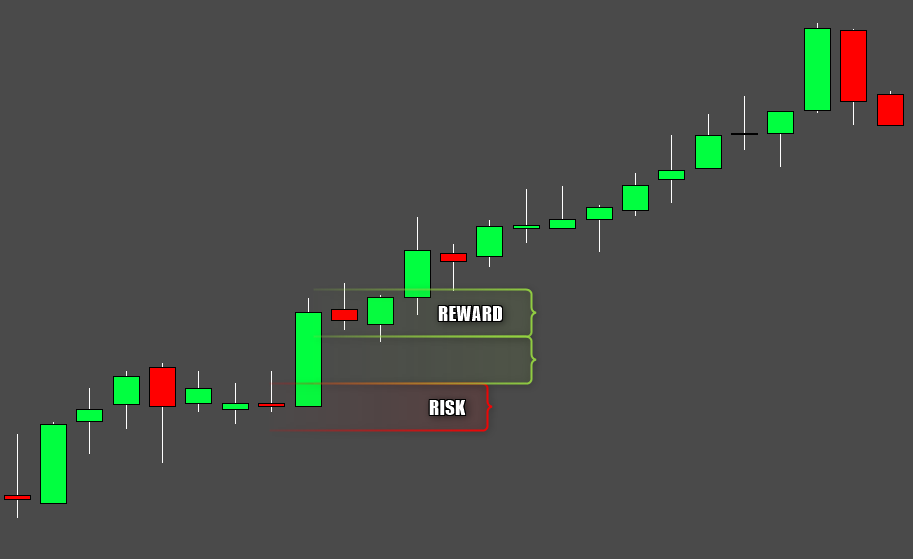
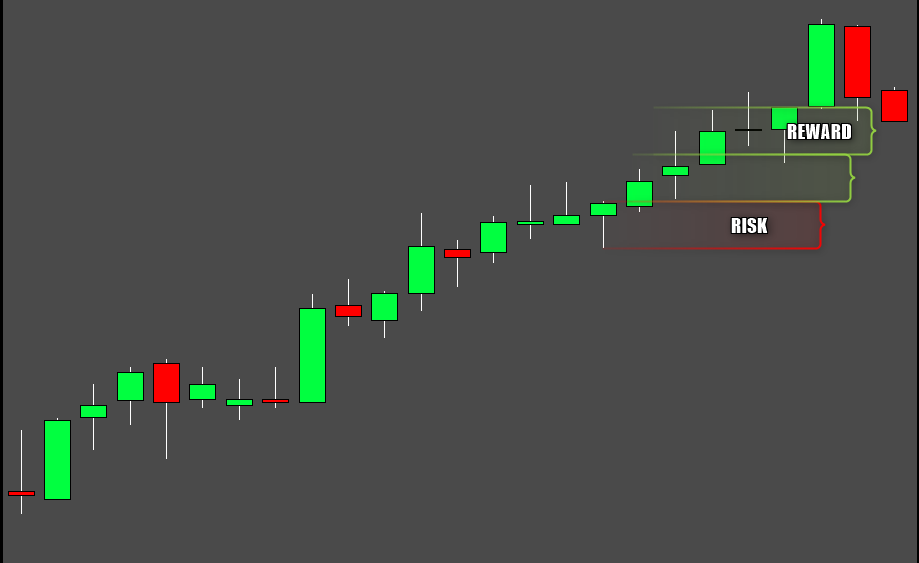
Based on the above, we can establish a new set of entry rules which we want to see before our entry.
Never enter on the 1st minute of the 5-min cycle
because there is very often a better entry and there is no confirmation about the trend continuation until the overlap creating candle gets broken up
Set the stop at the low of the overlap, creating candle
because it is never broken, we can consider it a good stop for a trend continuation pattern
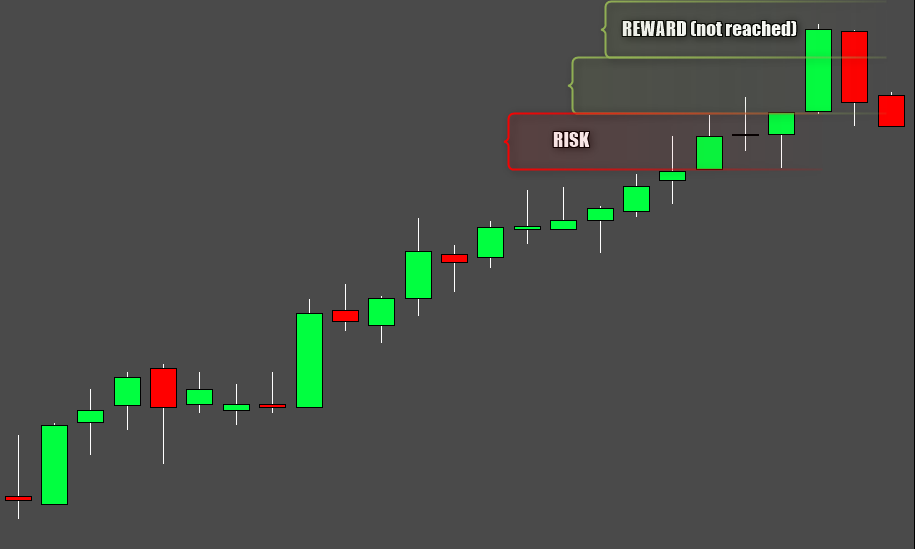
Don’t freak from the moves against your entry
if we are already in a position, and we see a candle with price going against us, and it is the 1st or 2nd candle of the 5-min cycle, we can be calm because this is what is supposed to happen. If you struggle mentally being in a position, knowing this can bring down the stress
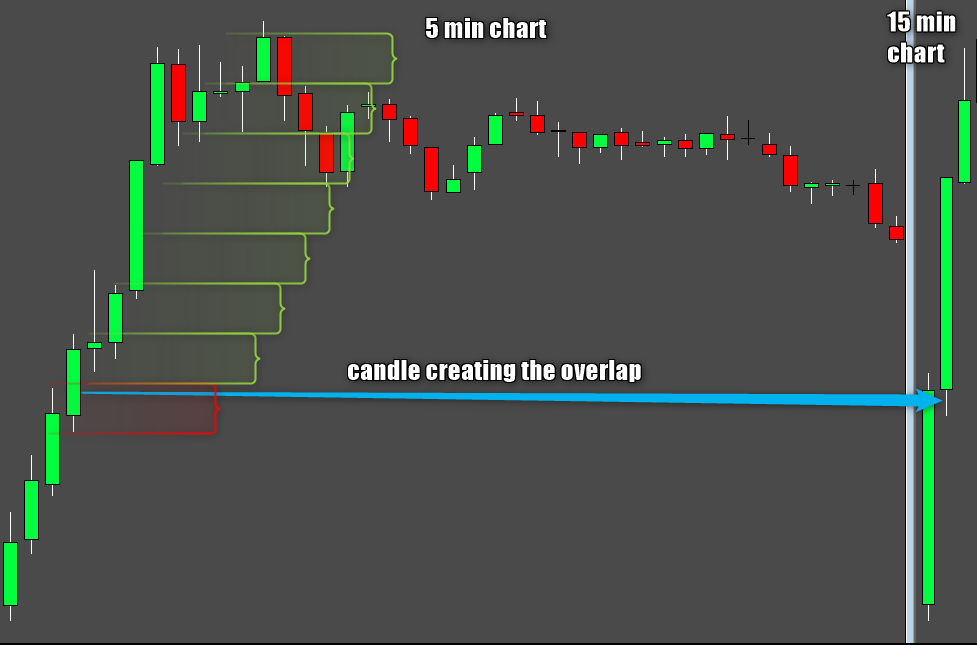
This example concerned the 1 min vs 5 min chart, but the very same principle can be applied to the 5 min vs 15 min chart. Please note, that other entry rules apply too but for making the point I simplify it.
Avoiding and using fakes
Knowing all the above, we can create another set of rules for not to be tricked into a position by market manipulator’s fakes.
If catching a trend, the first 1-min candle of the 5-min cycle has to go against it.
If the first candle is breaking up and green, it’s probably a fake. Especially if it is a candle without extreme volume or extreme size, far from the moving averages
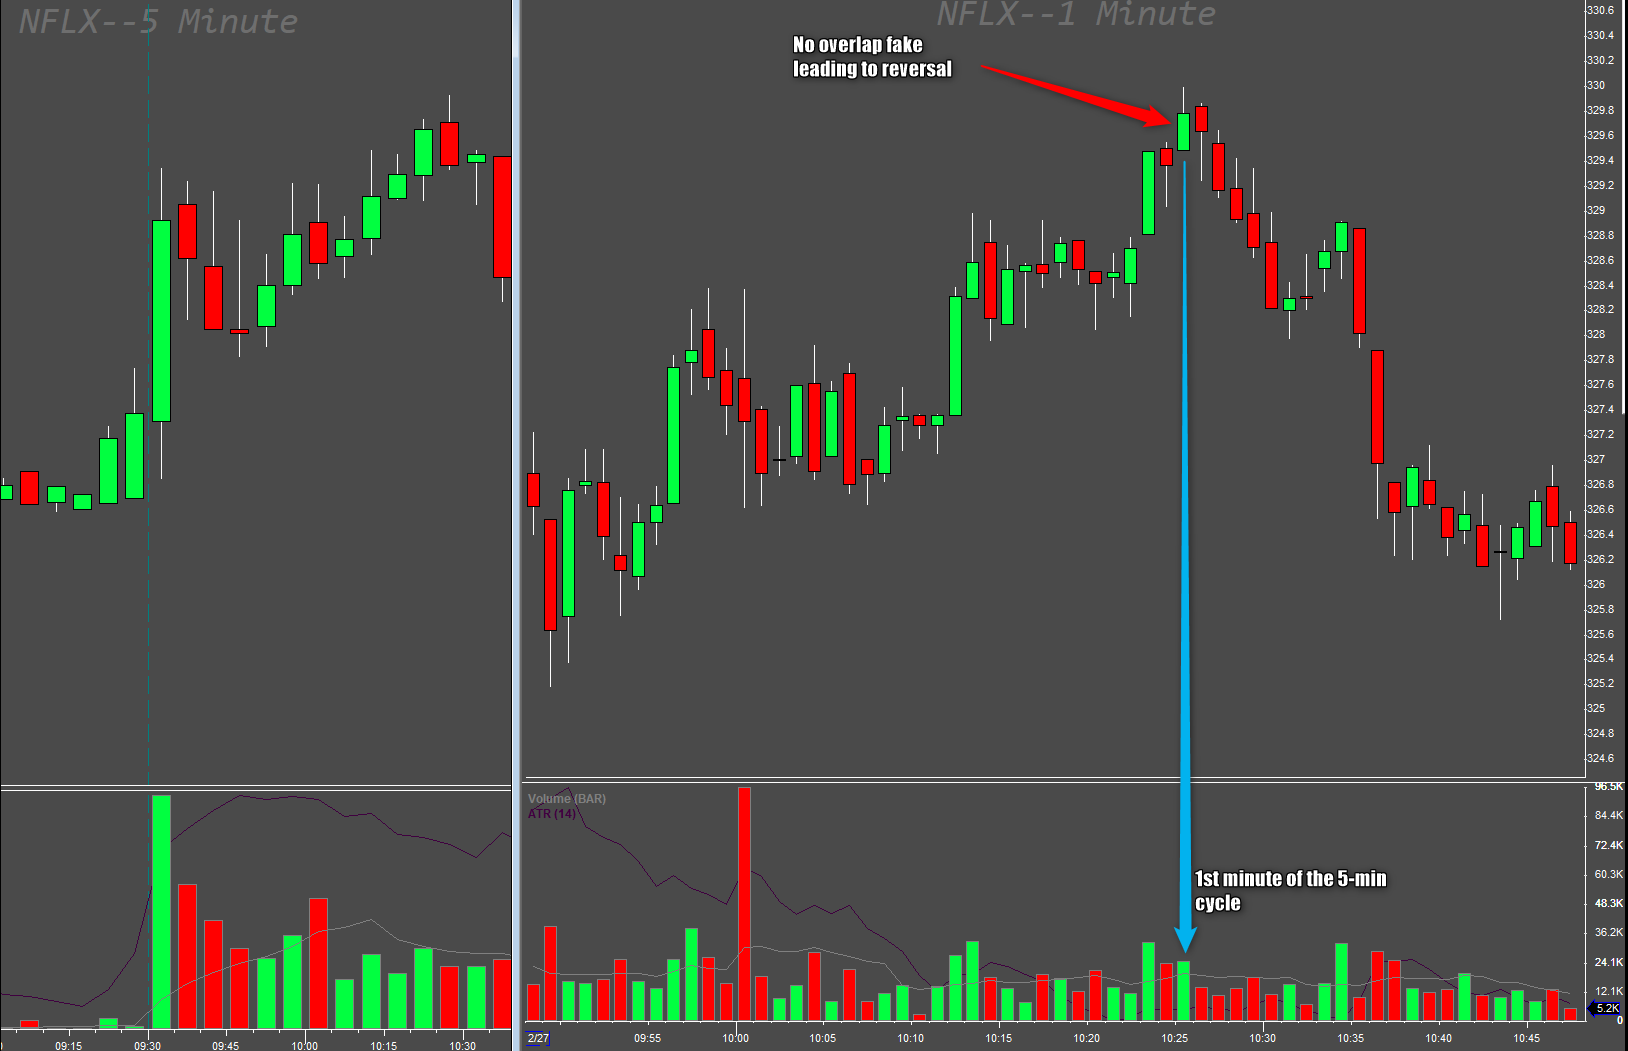
5-min chart on the left and 1-min chart on the right, but the same applies to different timeframes.
Knowing the fakes, we can also predict better reversals, so if you are trading the reversal pattern, it is wise to wait for the fake in the 1st or 2nd minute before you enter as in the below example.
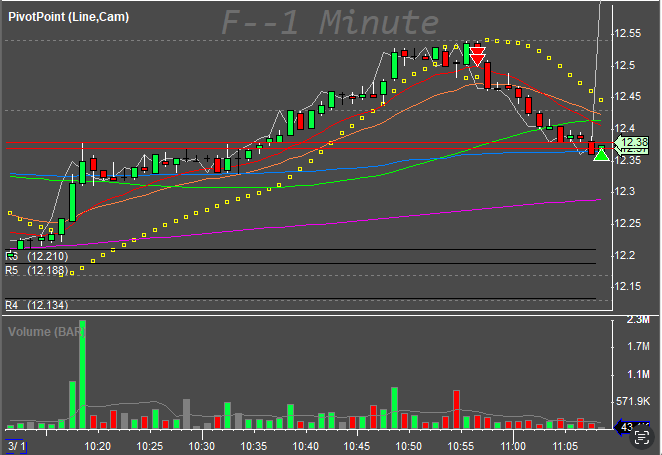
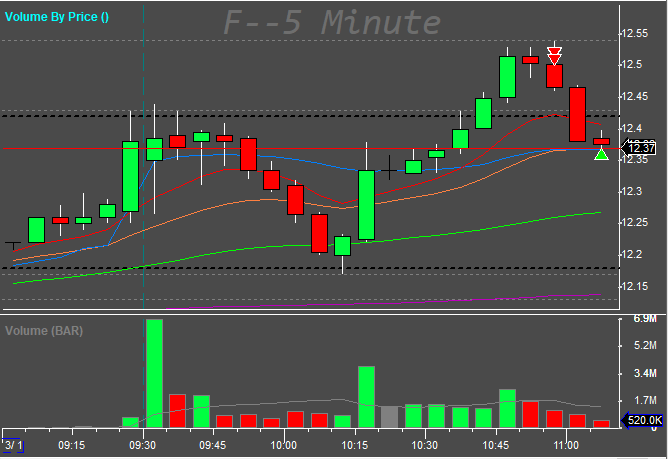
Some real life trades using this method:
Other considerations
When you will be trying to develop your style using these, here are some of my observations.
When the first candle had high volume or is bigger than other candles, the break is most likely real and if you don’t have other setup to trade these (like 3 BAR Play) then the entry is missed.
Expect pullback after every candle especially if it is 3rd and more candle in a row which was moving one direction
Distance from the moving averages help to see if the price action is an overlap or a pullback. See below
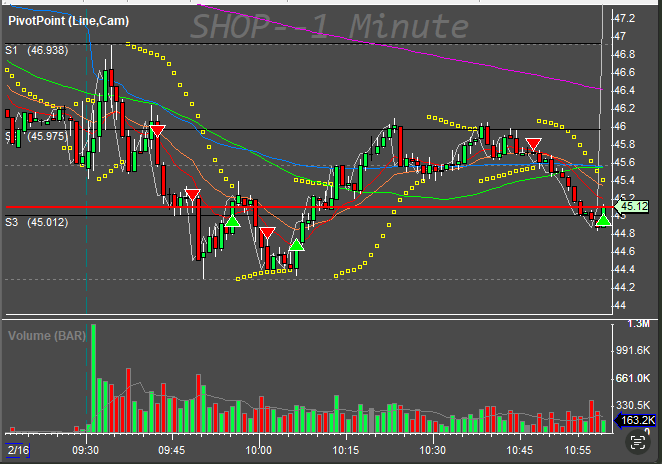
9:46 the candle is big, so a true break down after a moving average bounce
9:51 there is a fake candle for a pullback, so I better exited the trade
10:02 I re-entered after the 5-min overlap candle (reverse hammer)
10:06 I exited on the fake, expecting a reversal
10:47 took another trade after a small overlap was created on the 5-min chart expecting an ABCD pattern move.
The use of this method improved my entries a lot and I use them for reversals and trend continuation entries like ABCD or 3BAR plays. What I like about it most, is the fact that once I am in a position I am calm if I see a move against me as now I know that it is exactly what is supposed to happen.
@PeterB_242 on Twitter peterB#9795 on Discord

