
DAS Trader Pro Advanced Hotkeys part 63
Show the last fair value gap across your charts

What is a fair value gap and why it matters to some traders?
Here I went for help with the definition, to websites that deal with the topic. I am not focused on the strategy itself, so here is what I have found about the fair value gaps.
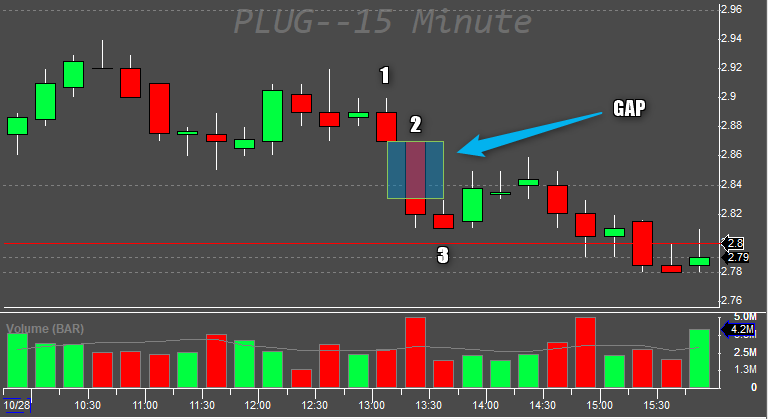
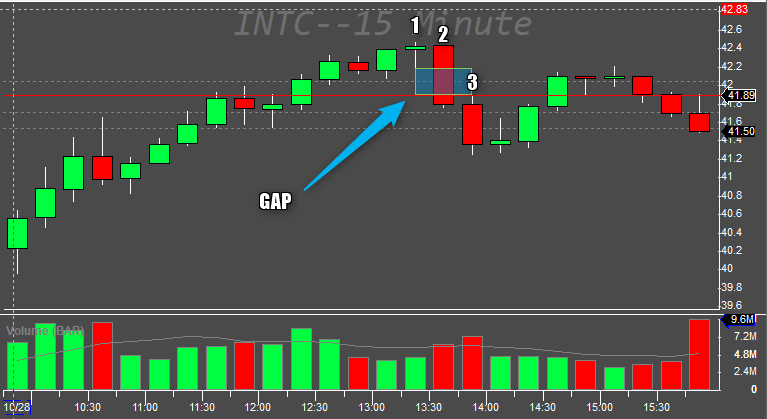
A Fair Value Gap (FVG) is typically formed through a three-candle sequence:
Candle 1 Initiation (Impulsive Move Begins)
A strong directional candle (either bullish or bearish) forms, often driven by institutional order flow.Candle 2 Expansion (Continuation)
The next candle extends the move in the same direction without retracing into the prior price range. This creates an imbalance in the market structure.Candle 3 Validation (Confirmation)
The third candle establishes the opposite end of the gap, leaving a “void” between the wick of Candle 1 and the wick of Candle 3.
This untested space between the wicks is the Fair Value Gap. A zone where price moved too quickly for normal trading activity to occur.
Why Institutional Traders Monitor FVGs
Institutions such as banks and hedge funds observe FVGs because these imbalances often act as price magnets.
Markets tend to revisit these areas to rebalance liquidity that was skipped during the impulsive move.
By identifying FVGs, institutional traders can pinpoint potential retracement zones, offering opportunities for strategic entries or exits.
Some traders perceive them as the footprints of smart money—evidence of where significant orders disrupted the balance and where liquidity is likely to return.
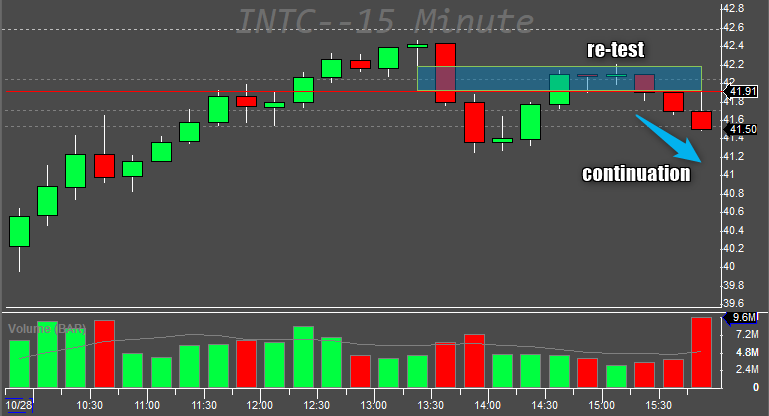
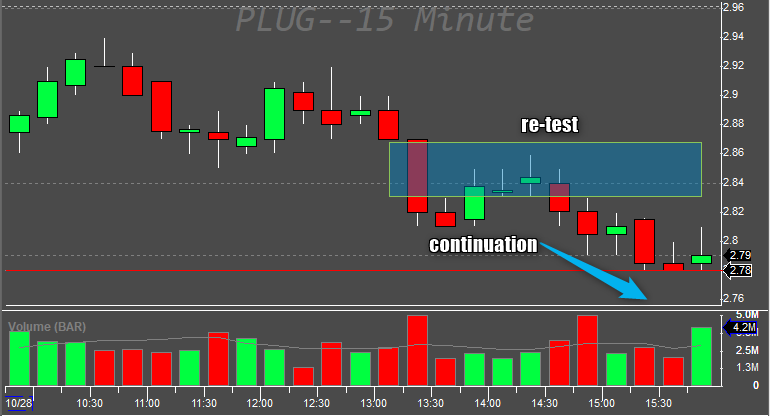
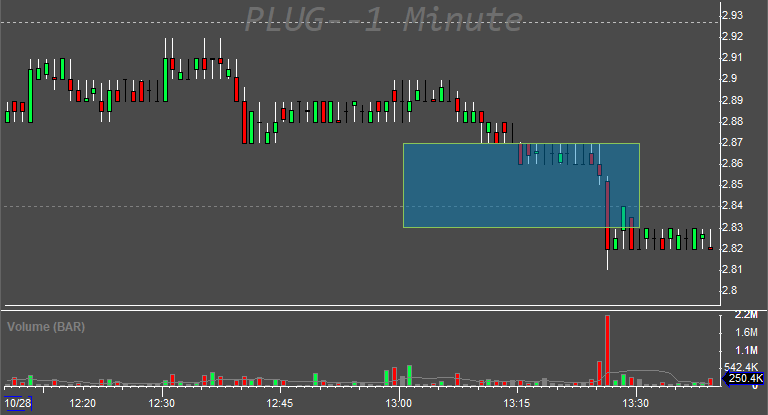
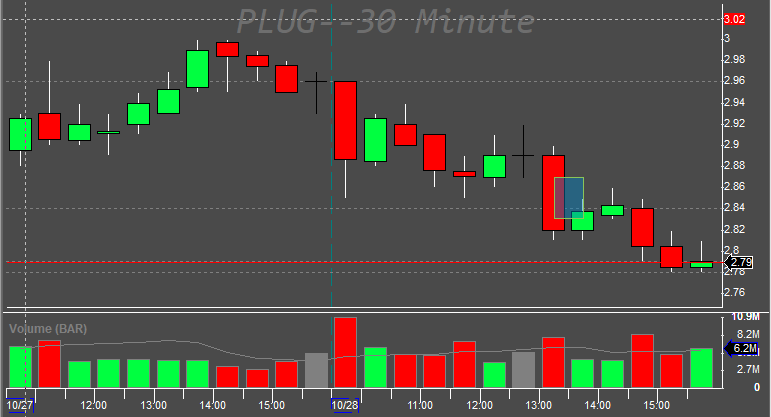
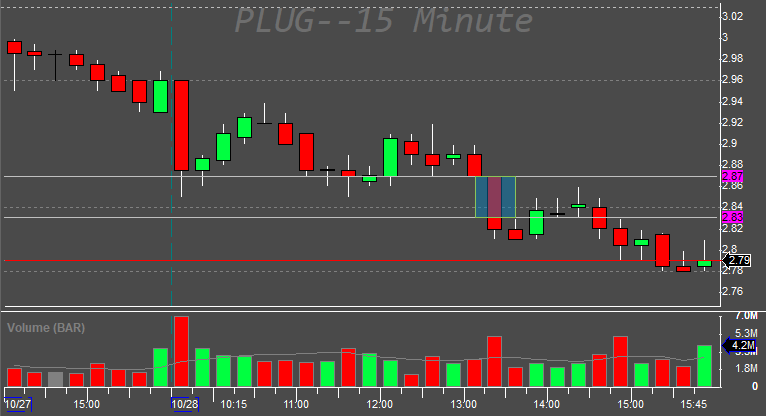
If I extend the FVGs shown in the previous pictures, it gets more obvious
One more example with a bullish FVG
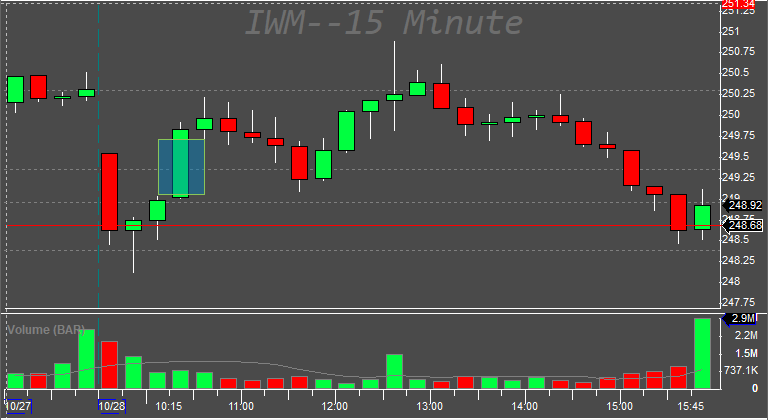
Technically, not all FVGs have the same relevance, so check your strategy properly before using it for actual trading.
How to find the last fair value gap on any chart
It can be all done in a single hotkey.
// settings
$MYFGVMINCHART=getwindowobj("MY15MIN");
$FILLCOLOR="0,128,192";
$LINECOLOR="255,255,0";
$TRANSPARENCY=-139;
$LINEWIDTH=1;
$THRESHOLD=0.003;
$INDEX=0;

// delete the last drawn FVG first
$rectangle=$MYFGVMINCHART.gettrendline("FGV1_"+$MYFGVMINCHART.SYMB);
if (isobj($rectangle)==1)
{
$rectangle.delete();
}

// start looking
while ($INDEX>-197)
{

// read the last 3 candle highs and lows
$BAR1LO=$MYFGVMINCHART.getbar($INDEX).LO;
$BAR1HI=$MYFGVMINCHART.getbar($INDEX).HI;
$BAR2LO=$MYFGVMINCHART.getbar($INDEX-1).LO;
$BAR2HI=$MYFGVMINCHART.getbar($INDEX-1).HI;
$BAR3LO=$MYFGVMINCHART.getbar($INDEX-2).LO;
$BAR3HI=$MYFGVMINCHART.getbar($INDEX-2).HI;

// test gap long
if ($BAR3HI<$BAR1LO)
{
if($BAR1LO-$BAR3HI>$BAR3HI*$THRESHOLD)
{

// bullish gap found. Draw the rectangle to the chart
$drawrectangle=$myFGVminchart.CreateTrendline("Rectangle");
$drawrectangle.name="FGV1_"+$MYFGVMINCHART.SYMB;
$drawrectangle.price=$BAR1LO;
$drawrectangle.time=$MYFGVMINCHART.getbar($INDEX).Time;
$drawrectangle.price1=$BAR3HI;
$drawrectangle.time1=$MYFGVMINCHART.getbar($INDEX-2).Time;
$drawrectangle.visible=1;
$drawrectangle.Fill=1;
$drawrectangle.Fillcolor=$fillcolor;
$drawrectangle.color=$linecolor;
$drawrectangle.linewidth=$LINEWIDTH;
$drawrectangle.transparency=$transparency;
$drawrectangle.sendtoglobal();

// job done end the script
return;
}
}

// test gap short
if ($BAR3LO>$BAR1HI)
{
if($BAR3LO-$BAR1HI>$BAR3HI*$THRESHOLD)
{

// bearish gap found. Draw the rectangle to the chart
$drawrectangle=$myFGVminchart.CreateTrendline("Rectangle");
$drawrectangle.name="FGV1_"+$MYFGVMINCHART.SYMB;
$drawrectangle.price=$BAR1HI;
$drawrectangle.time=$MYFGVMINCHART.getbar($INDEX).Time;
$drawrectangle.price1=$BAR3LO;
$drawrectangle.time1=$MYFGVMINCHART.getbar($INDEX-2).Time;
$drawrectangle.visible=1;
$drawrectangle.Fill=1;
$drawrectangle.Fillcolor=$fillcolor;
$drawrectangle.color=$linecolor;
$drawrectangle.linewidth=$LINEWIDTH;
$drawrectangle.transparency=$transparency;
$drawrectangle.sendtoglobal();

// job done end the script
return;
}
}

// if no gap found in the last 3 candles, move to the previous candle trio
$INDEX=$INDEX-1;
}
The code contains the step’s description, but in general, it loops back in time through the chart candles and takes any trio and looks for the gap between 1st and 3rd candle in the trio.
The first lines of the code contain the settings for the gap
// settings
$MYFGVMINCHART=getwindowobj("MY15MIN");
$FILLCOLOR="0,128,192";
$LINECOLOR="255,255,0";
$TRANSPARENCY=-139;
$LINEWIDTH=1;
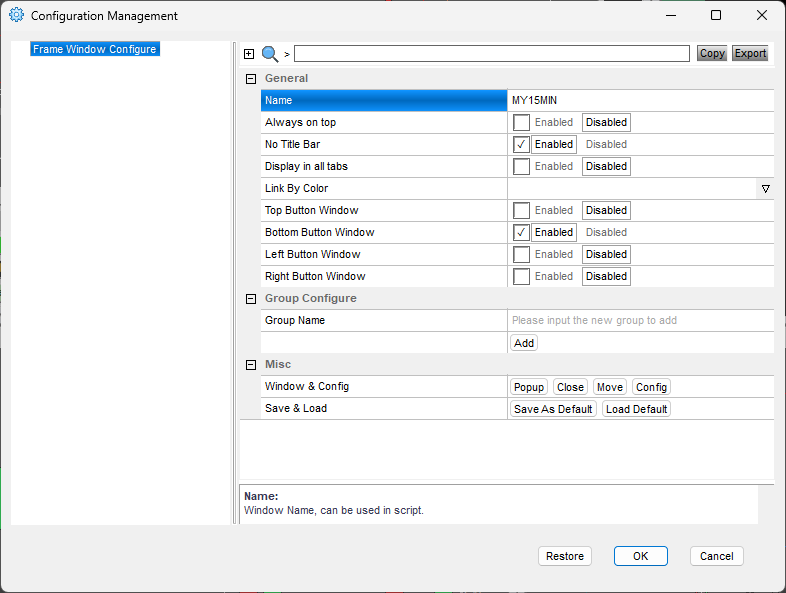
$THRESHOLD=0.003;The first line defines the chart name, where you want to scan for the gap. I use the 15-minute chart window names MY15MIN
What follows is the design of the rectangle, so feel free to play with the colors and transparency.
The last line is the threshold number. It is calculated as a percentage of the price of the 3rd candle. With a value of 0.003 it means 3% of the price. If the price is $10 then a gap of 0.30 or bigger is being considered only. This is to solve the problem with differently priced symbols.
The rectangle is drawn as global so it is visible on all other charts
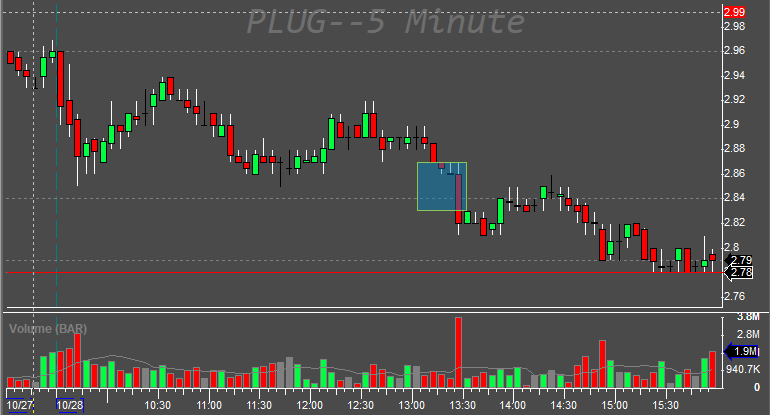
For even more visibility, it can be easily extended by adding horizontal lines to the rectangle
By counting the rectangles it can be easily extended to show the last 2, 5 or 10 FVGs
Automating the FVG drawing
By calling the above hotkey on each symbol change, we can have a very convenient way of showing the gap automatically. Just save the code as a hotkey with a name, then call it on the symbol change event you detect in a chart update script. The technique is described here.

The limits
IT scans only for the last 200 candles max due to the hard limits of DAS Trader Pro at the date of writing.
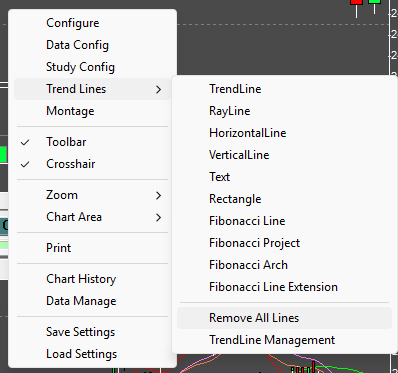
If you scroll through many symbols every day, you might need to increase the line drawing count limit in your DAS or do an occasional cleanup with Remove All Lines manually or with a hotkey.
Let me know in the comments if you trade the FVGs and if you find it useful. Your feedback is important to me! Thank You for reading.