


DAS Trader Pro Advanced Hotkeys part 41
Draw a line of your stop on all charts

Draw a line of your stop on all charts
Sometimes you want to see your stop on higher time frame charts on all charts and the side marker is not enough.
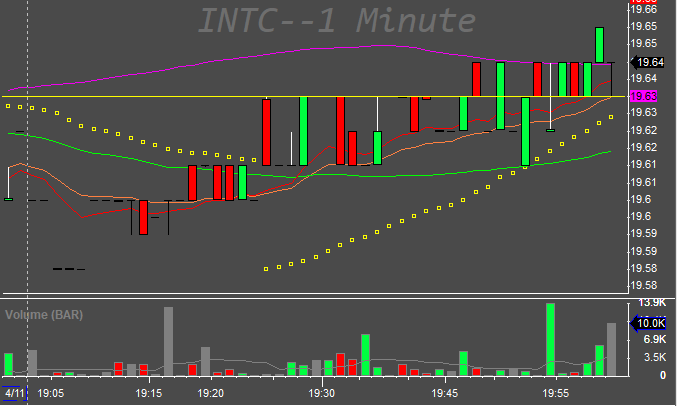
The yellow line shows where I set the stop.
The limits and requirements
I will start with the limits, as it is crucial to understand the mechanism on how the above solution works.
This solution requires you to set the stops with hotkeys or hot buttons and not dragging the order on the chart because we cannot read the existing orders properties yet.
The mechanism is simple
store the value where you set the stop last time
delete the existing line if it exists
draw the new line to the newly set stop
For this, it is required that your entry hotkeys or set stop loss hotkeys or partial hotkeys that set a new stop contain one variable that sets the stop. For me and for this article, it is the $MYSTOP variable.
Another limit is that using single $MYSTOP variable, it works for single position opens. If you need to use it for multiple positions opened at once, you will need to store the multiple stops in dynamic variables or custom object. For the purpose of this article, I want to keep it simple.
The requirements are
named montage window and created montage object
named chart window and chart window object
This has been covered in the previous posts and recently in the

my montage object variable is called $MONTAGE and my 1-min chart window object is called $MY1MINCHART.
Another limit is the DAS Trader Pro max line count limit, which can be managed as described in the very first post of the series

so make sure you set the limit high enough or that you delete your global lines often not to be surprised that you cannot draw any more lines.
Prepare the hotkeys
If you use your own hotkey or one of the hotkeys I provided previously, you need a line in the hotkey that states
$mystop=price;or with the new syntax
$mystop=$MONTAGE.price;Meaning, set the $MYSTOP to the value shown in the montage price field. This value gets set by double-clicking on the chart. This is common practice when defining the stops by clicking. If you set your stop by calculations for example like HOD or PDC you will need to set the $MYSTOP to that value
$mystop=PCL;or
$mystop=HI;or with the newer syntax
$mystop=$MONTAGE.hiImportant is that you do it in the same hotkey where you set your stop order.
Draw the line where the $MYSTOP is
For this, we need a script that reads the $MYSTOP and draws the line at the same place. It is not that simple though, as we need to manage the existence of previous lines, so we need to determine if we have a position opened, then draw the lines where the last $MYSTOP value has been set. This is a logical assumption that the $MYSTOP is set and kept only if we used the entry hotkey or set stop loss hotkey or partial hotkey. There is no other way how a $MYSTOP would be set.
Save this hotkey and name it “drawstopline”
if ($MONTAGE.POS>0)
{
$drawstopline=$my1minchart.gettrendline("drawstopline");
if (isobj($drawstopline)==1)
{
$drawstopline.delete();
}
$drawstopline=$my1minchart.CreateTrendline("horizline");
$drawstopline.name=drawstopline;
$drawstopline.price=$MYSTOP;
$drawstopline.Visible=1;
$drawstopline.color="255,255,0";
$drawstopline.labelbgcolor="255,0,255";
$drawstopline.SendToGlobal();
$drawstopline.save();
}
else
{
$drawstopline=$my1minchart.gettrendline("drawstopline");
if (isobj($drawstopline)==1)
{
$drawstopline.delete();
}
}
The hotkey checks if there is a position opened first. Then it checks if a line is drawn already or not. If a line exists, it deletes the previous line and draws the new line. If there was no line, it will just draw the new line. And if the position is 0 it makes deletes the not needed line.
Test and tune
Now open a position and set the stop with a hotkey of your choice and call the above drawstopline hotkey.
It should draw you the yellow line with purple background
If you want to adapt it to your needs, just edit the corresponding color section in the drawstopline hotkey.
Test it several times to cover all your use cases. After each setting of the new stop, press the hotkey and see if it does what it is supposed to do.
Automatic line drawing
Now that you are satisfied with the drawing, it is a matter of adding one simple line to your timer event script.
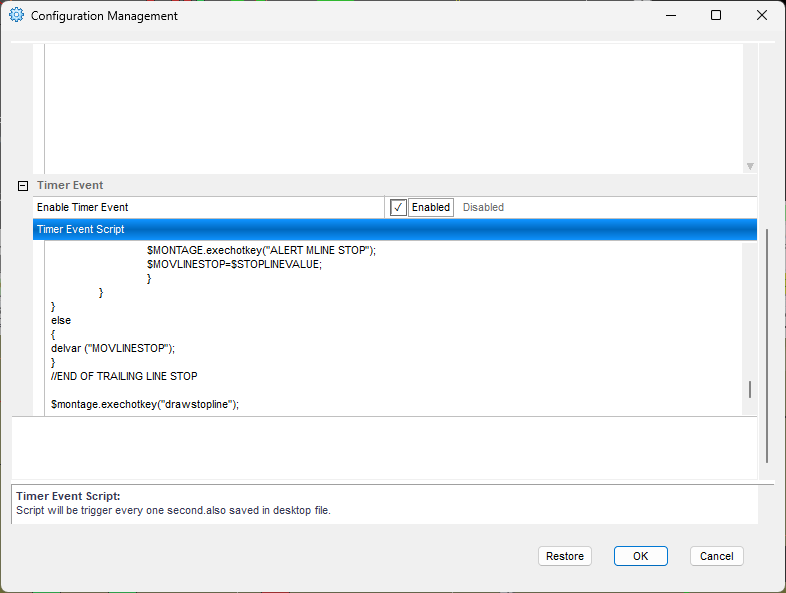
Just add the line
$montage.exechotkey("drawstopline");into the script area and it will get executed every second for you. I chose this area rather than chart update script as it I try to use chart update script only for things that really need fast execution and this one, being just an indicator, surely is not needed to be as quick.
hi peter good stuff ! questions , how do you add bottoms on the chart? "clean chart" for an example ?