

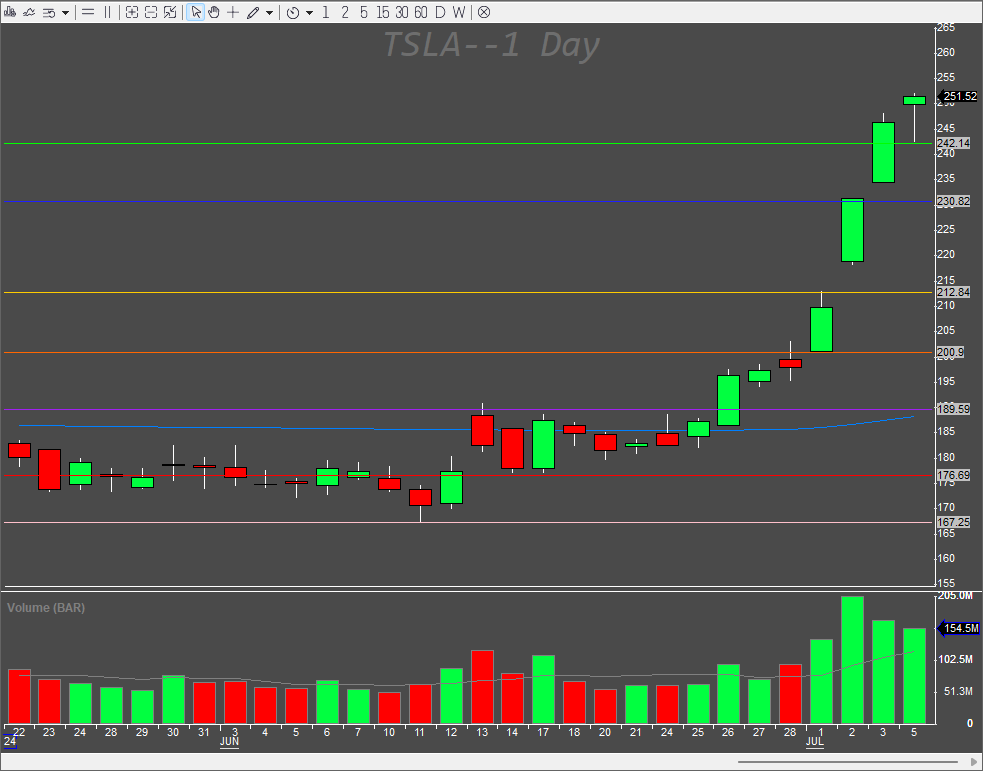
Since DASTrader version 5.7.9.7 we can draw colored lines as a parameter
The hotkey syntax is very simple
DrawHorzLineWithPrice($myprice,color(blue));The problem with this syntax is that we might not like that kind of blue, and we do not know what colors does DASTrader recognize. If you use an unknown color name you will get a default colored line (black);
For this, it is better to use RGB color codes to get any color from the RGB scale.
You can get the RGB color numbers on any color picker website.
The RGB color code syntax is as follows.
DrawHorzLineWithPrice($myprice,color(32,32,255));The color is a general function, so it could be used for other coloring in DASTrader in the future.
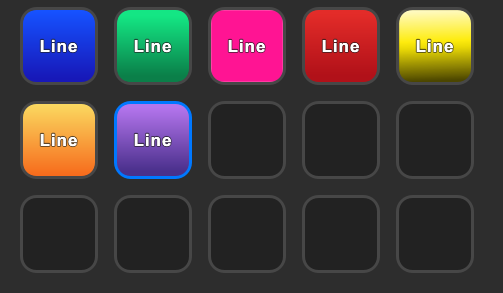
You can then make a hotkey for each color. It is especially nice and easy with StreamDeck
To populate the $myprice variable with the price we want to draw the lines at is also simple. If we have enabled double click to trade as explained in my previous post, we can just assign the clicked PRICE to the variable like this
$myprice=PRICE;If we want, we can assign the $myprice calculation based on any indicator, other variable or constant value as well.
To put it together as on the pictures above, we need to create 7 separate hotkeys. To be able to draw a line to a chart, the focus window needs to be a chart window. So if we do hot buttons which are present on the montage, by clicking the button we lose the focus as the window in focus will be always the montage window.
This has to be treated with the FOCUSWINDOW function, which needs to be called before the DrawHorzLineWithPrice funcion.
To be able to focus any chart window, we need to name the chart window first.
To name the chart window (or any other window) just right-click the window header and edit the corresponding Name field
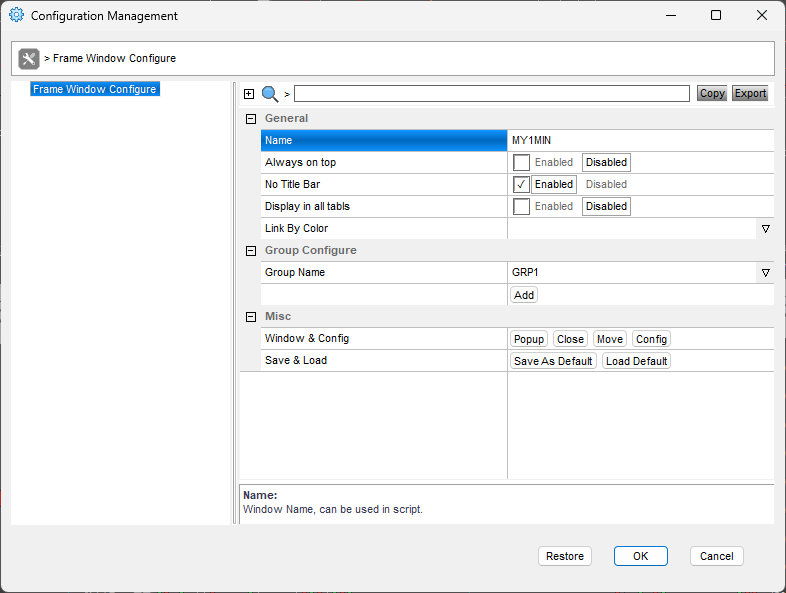
Always remember that the window names should be unique for any script to work properly.
Hotkey to add a blue line to the charts.
Keep reading with a 7-day free trial
Subscribe to Peter’s Substack to keep reading this post and get 7 days of free access to the full post archives.