Why do the parabolic reversals work?
Where does the edge of a strategy come from?
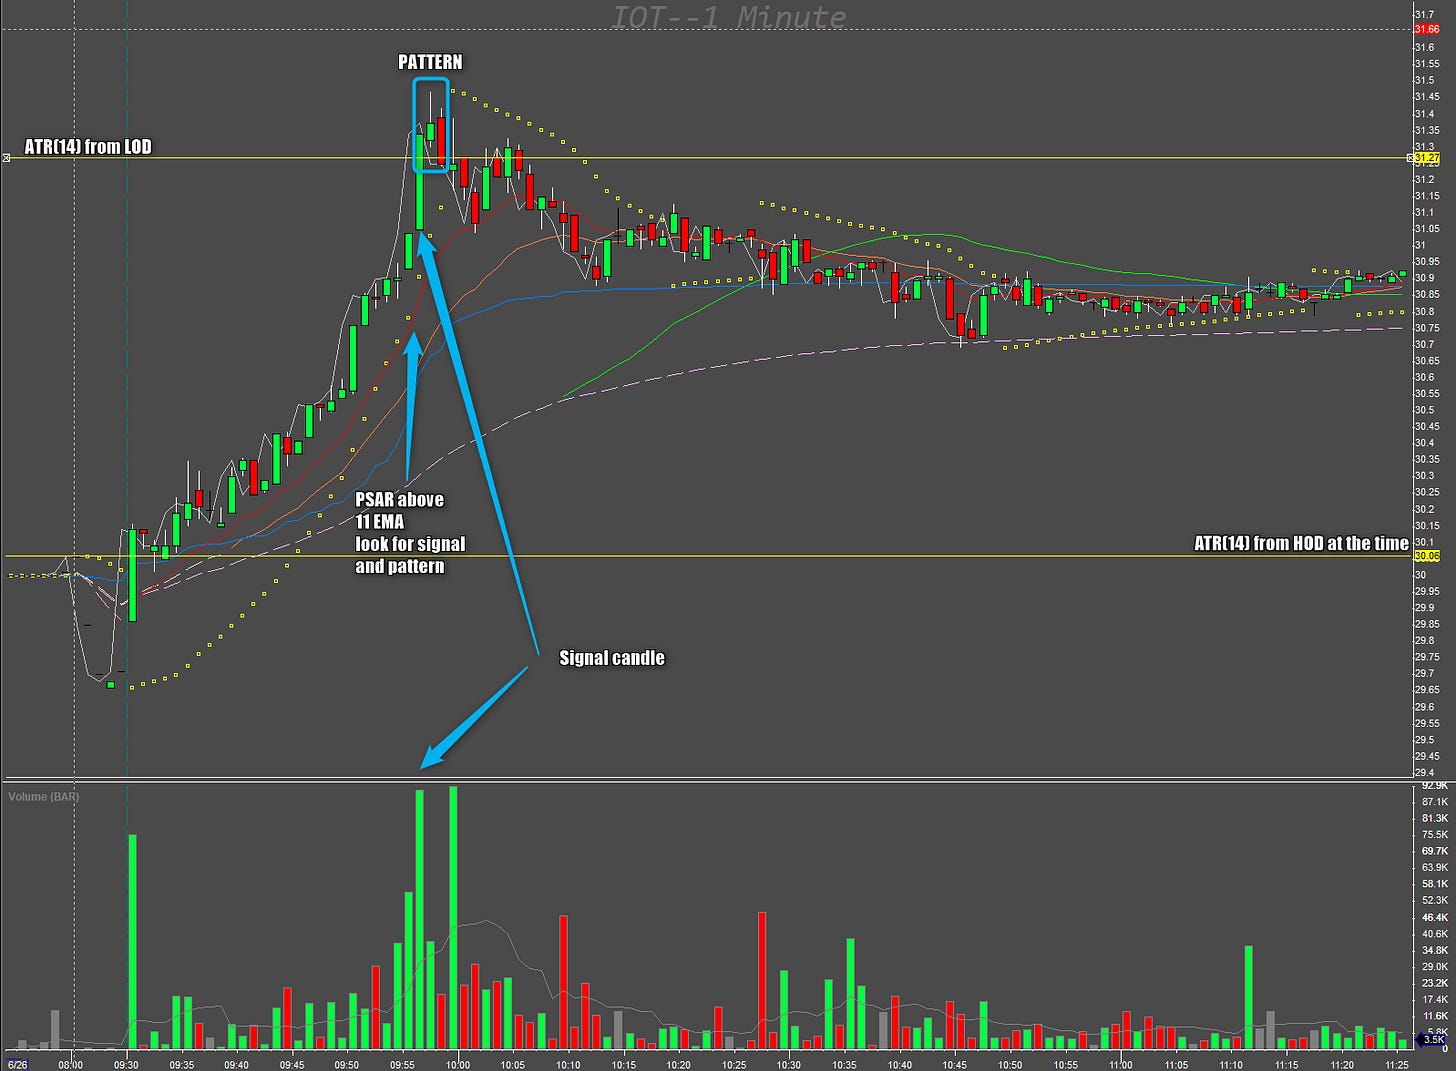
Today I will share my view on the parabolic reversals on an example I saw this week, despite the fact that I missed the trade.
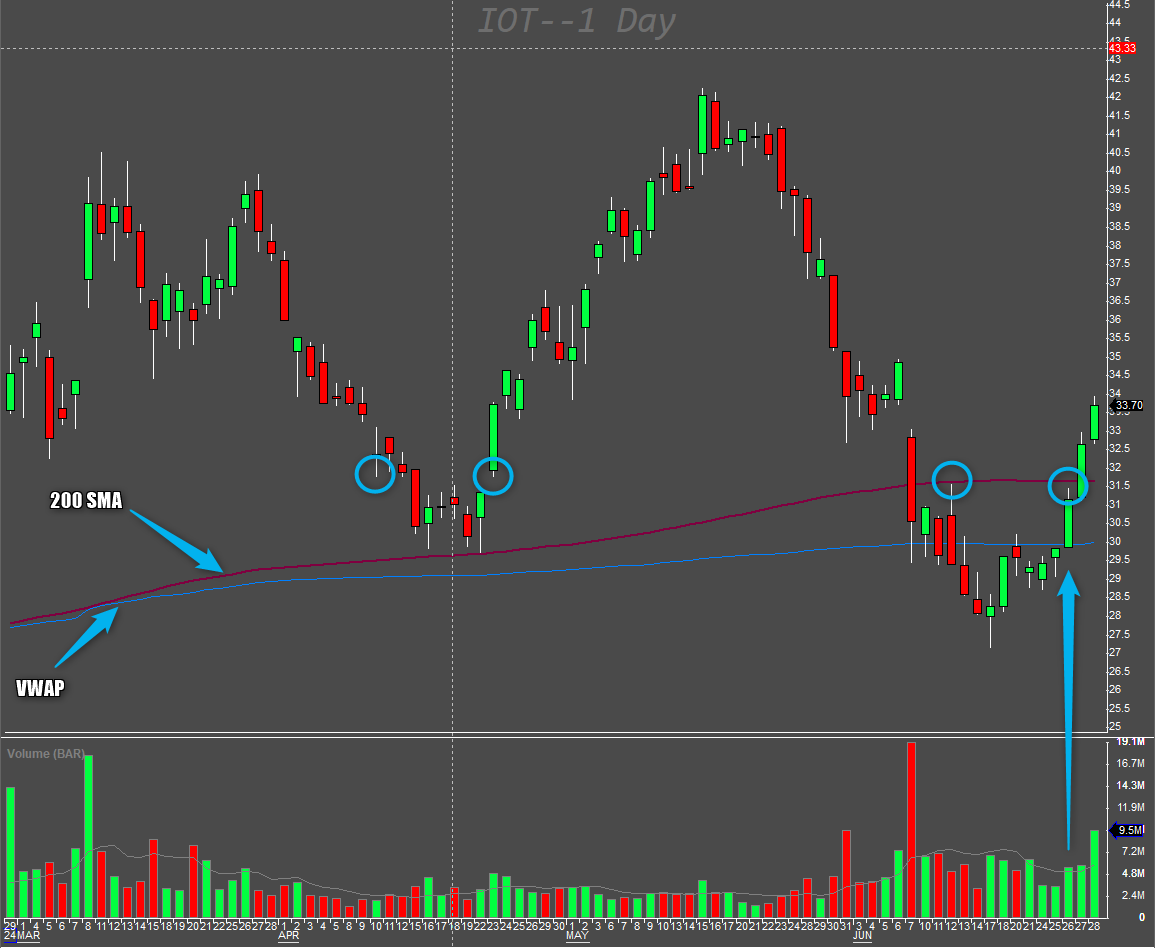
I believe that one picture is worth a thousand words, so here I provide the two pictures of the trade
It would be a no stress winning trade as the entry was so clear, and it never retested the stop loss area.
Finding the stock to trade is the matter of finding the signals and then an entry pattern.
Now I do not want to go through the technical reasons for the trade yet as these have been heavily described in my trade of the week series.
I want to write about the reasons why this works so often that we can build our trading around it. As we all know, our trading edge comes from statistical probability of an event or a series of events.
My hypothesis is as follows:
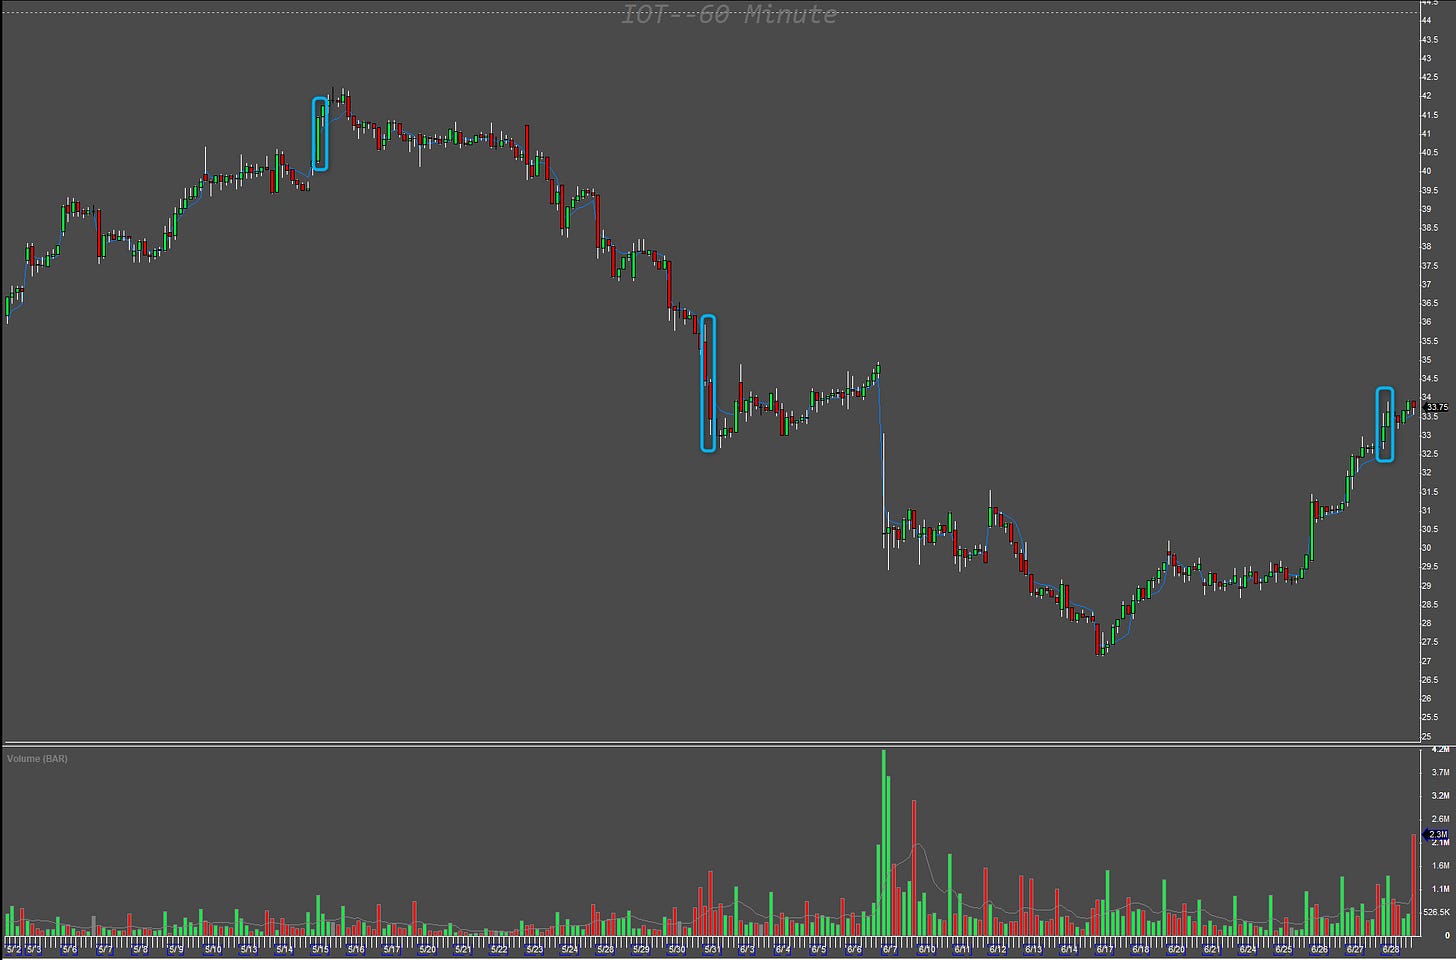
How many times is a big 60-min candle followed by the same color candle without a pullback?
Let’s see it on the following chart, which is showing the Symbol IOT 0.00%↑ since the beginning of this year. This means it is a few hundreds of candles. We are looking for pairs of candles answering the hypothesis.
Quite surprising results for some. It happened 3 times in 6 months. Now from this statistical fact we can turn it around and say some statements which all basically say the same thing.
nearly every 60-min candle is followed by a pullback. Smaller or bigger but there is a pullback.
if we trade against the first 60-min candle, we will statistically win if we get the target right.
If we take a trade close to the time at the end of the 60-min candle, there will be a profitable exit somewhere on the next candle over 90% of the times.
Does that sound like enough edge for you?
The reasons why it works like that are beyond my mathematical skills, it can be anything from Fibonacci sequences and retracements to seasonality or human psychology. The point is that it does not matter much, as the stats say it clearly. It happens so often that it is hard to ignore.
But hold your horses, it is not as simple as it sounds. To have a profitable strategy we need to find a proper stop loss and a profit target as well. Therefore, we look for known patterns or candles that happen at certain areas of interest.
For parabolic reversals, my areas of interest include
Camarilla pivot point levels 4, 5 and 6
previous daily/weekly support and resistance levels
strong moving averages (50 SMA and 200SMA)
ATR(14) (the yellow lines on the charts)
The overall picture matters too.
if the stock is in a clear downtrend, going short is giving us potentially a bigger chance of a win and also a bigger move as the big money will flow in the bigger timeframe direction (trend) more likely
If the price action comes after a bounce to an area of interest for the first time, the chances of the bounce from that area of interest are higher. How many times have you seen a stock to go through a 200SMA without any hesitation? On any timeframe…
Now we need to combine it together. The theory with the areas of interest and the bigger picture. Some people like to include news into the consideration too.
The ideal stop loss and target is a matter of your hard work on the data collection. You need to test it yourself and see what works most of the time for you, because it is your eyes and your brain processing the information you see. If you decide to trade only one stock e.g. AMD 0.00%↑ and you never see anything else than AMD 0.00%↑ then you need to apply the principles based on your own perception of AMD 0.00%↑ as you have decided to watch it, potentially missing a lot of statistical data from other stocks, but that is ok. This is why you hear a lot, that there is no right or wrong trading. It is a balance of how you work with your data and how you perceive the charts with your very own eyes and brain.
Obviously simillar view can be applied to different timeframes with more or less success but the same principles can be applied to any of the strategies you trade. Break-outs or after-pullback trend continuation plays, level2 reading or anything else. It just needs a confirmed theory with enough statistical evidence in your favor.
What do you think? Let me know in the comments!


