

Having a poor performance period, is there anything to see some light at the end of the tunnel? Finding the cause of your underperformance can rise your motivation level higher because when you see that the success is at reach, you will not question your abilities and will more likely focus on the right stuff.
% of mistakes per # of trades
This is a good indicator of overall improvement. I do it monthly, but for more focus even weekly stats are reasonable. Take the number of trades performed and count how many times you have made a mistake. Compare this number with the previous period. If there is improvement, the results shall follow. If things are getting worse, refocus on quality rather than quantity because even a no trade is better than a trade with a mistake.
This is easily done on paper or in any spreadsheet editor. Just count the trades and the mistakes and divide them
So if you took 30 trades and 10 of them were breaking the plan, you get:
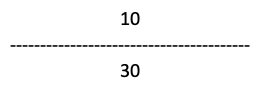
which is 1/3 or 0.33
Compare it with the previous periods to see if the number gets higher or lower.
Higher means worse, while lower means improvement. Do not expect big changes to the improvement side, while the big drops to the worst are very common.
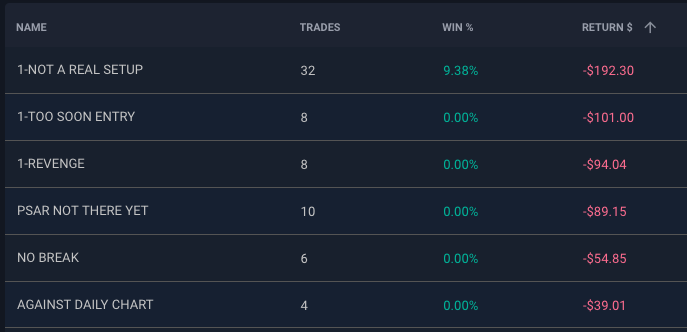
The most costly mistakes occurrence
Take the stats of your mistakes and see which mistake was the most costly one while being also quite often.
Costly can mean how much it cost you in losses but also how much it cost you of profits, so do not forget to count the what-if scenario for early exits too.
There are 2 todo’s to see the most costly mistakes.
One is just by purely ordering the mistakes by cost in my journaling platform.
The other one is to go one by one on the trades and count the number of R which I would have if I would not break the rules and did not make the mistake. I do it simply on paper one by one and count the R if my target would be reached without the mistake or not. A typical mistake for this is the early exit. I do it with the help of my journaling platform on the charts, where it is nicely visible if my stop or target has been reached
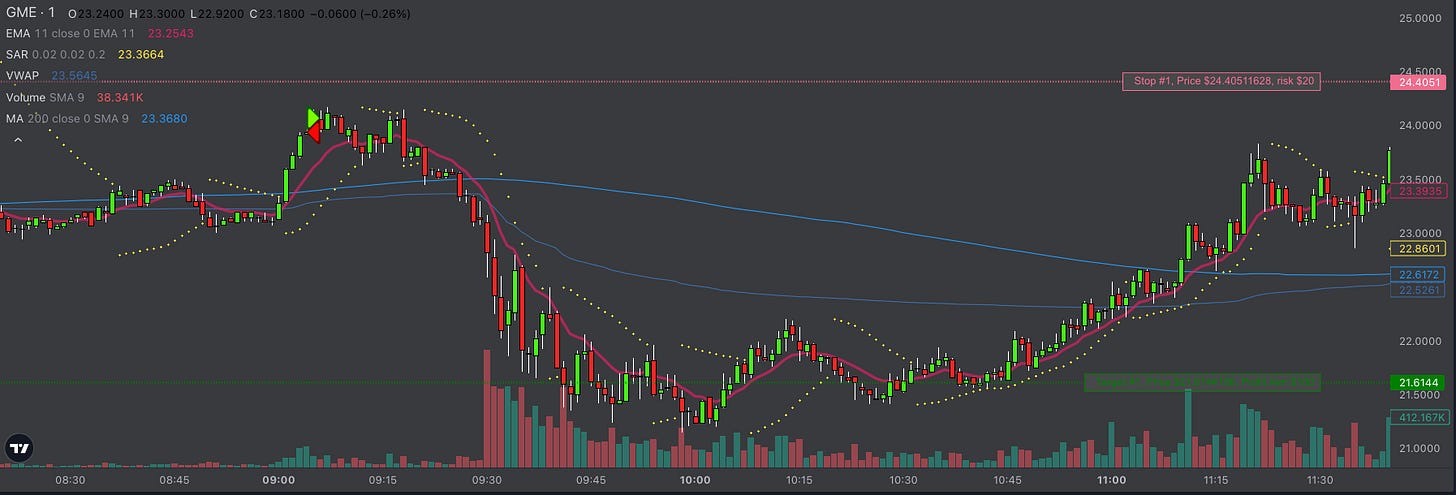
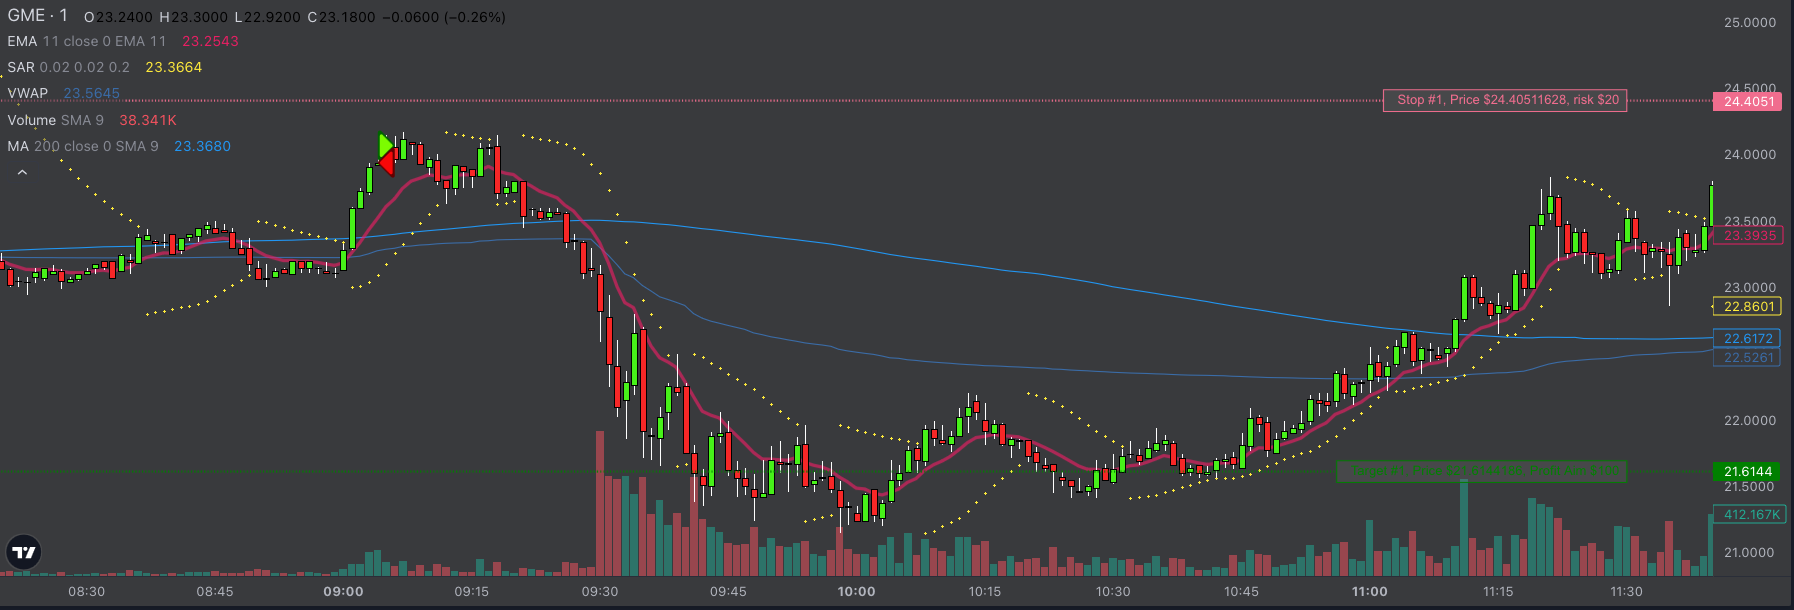
Example of an early exit visible on the chart. The red line shows the planned stop which has not been honored, while the green line shows the target for the strategy, which would have been reached. This is a 5R mistake.
The result of this analysis shall be the biggest focus for the next period. The outcome can be rather surprising, as the most costly mistakes can be technical issues or too much partialling or something else. So do not assume anything, just see what the numbers are telling you. If it is too many technical mistakes like wrong key presses, try to solve that too with improving the ergonomy of your execution, make the making of mistakes harder.
Trading potential
I always compare the scenario without mistakes vs my actual performance to see if I still have an edge if executed as planned. Obviously this needs very honest journaling, but if you do it, you will have the data to rely on.
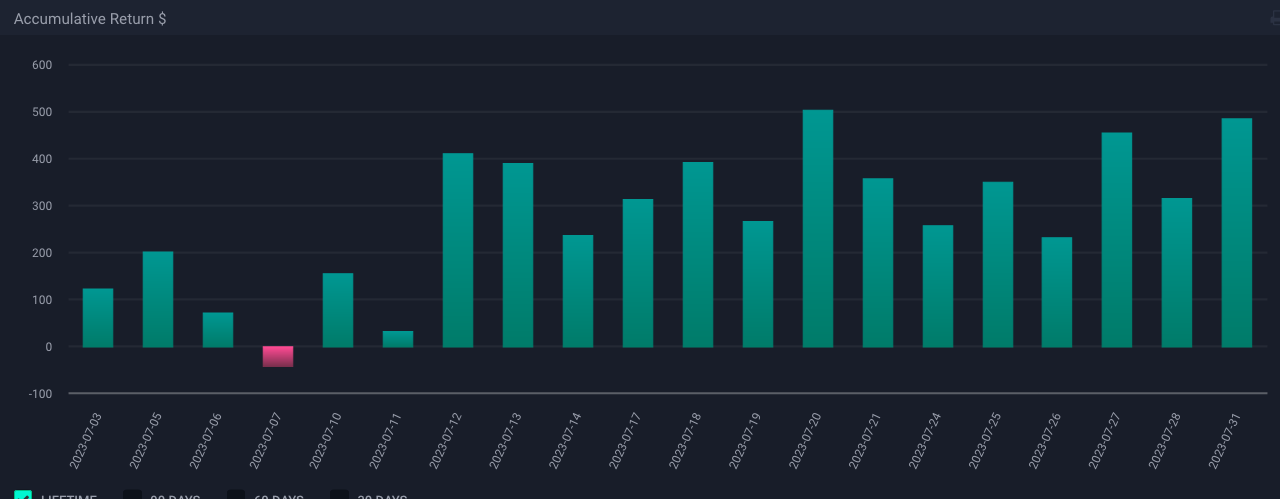
Example actual performance graph:
Versus the potential performance graph without mistakes
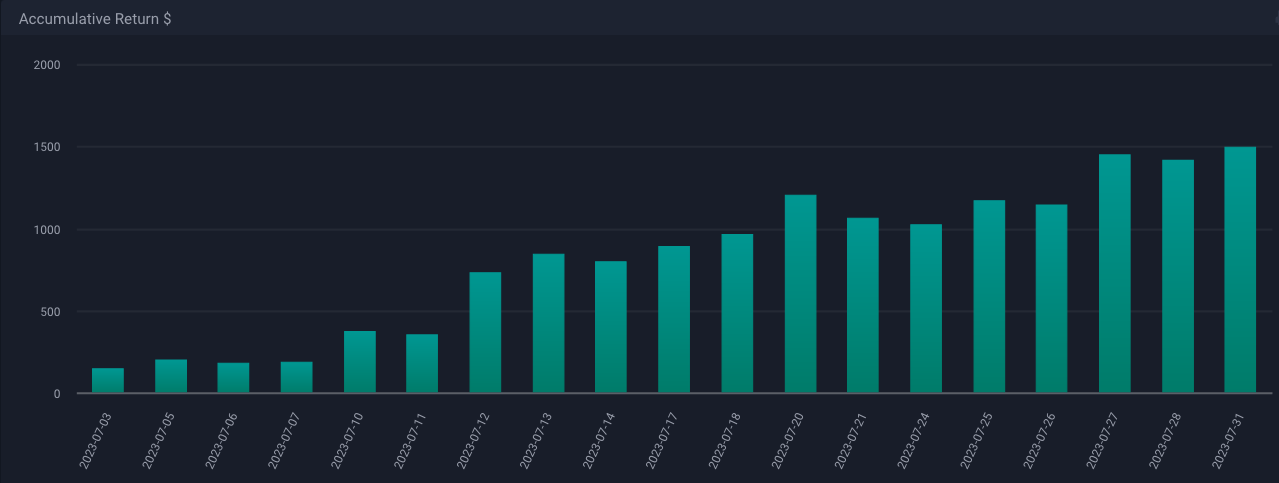
If I see a declining trend on the without mistakes, it means that my edge is gone, and I usually need to adapt by changing rules for entries or focusing on different setups that have more edge. If I see the big difference, it motivates me more to not make the mistakes for the next focus period.
The journaling platform I use for these analyses is Tradersync as mentioned in the previous posts.