

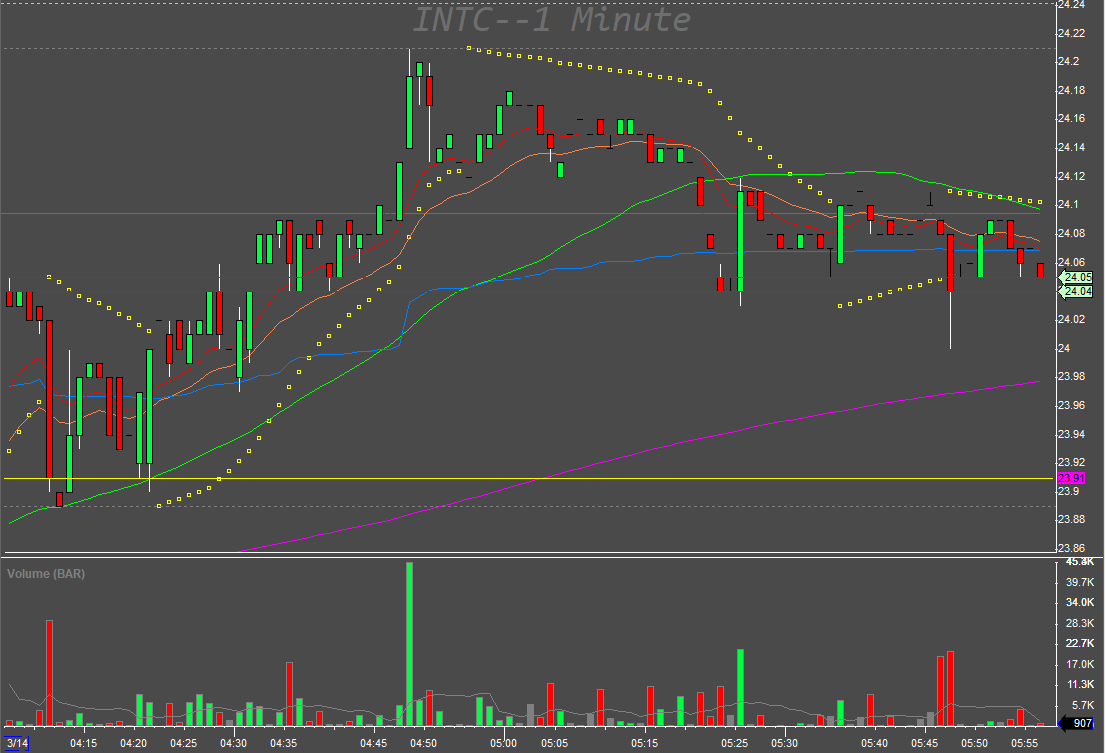
As you know, the extended hours stops have a limit that they cannot be dragged on the chart as a traditional order, so I thought it would be a good idea to have something which I can drag instead of doing click+replace all the time.
Since few versions back, the drawn lines can be named and have some properties which allows us to read its value and change its colors.
By clicking at the line, we can choose Config and see this screen
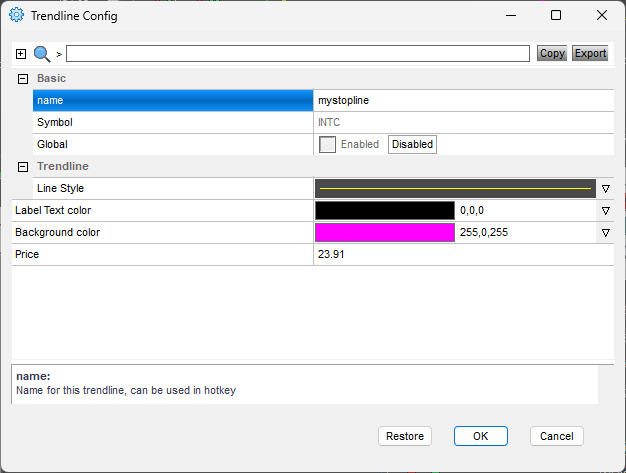
A line like this can be created with this code (the chart window name is MY1MIN)
$my1minchart=GetWindowObj("MY1MIN");
$MYSTOPLINE=$my1minchart.CreateTrendline("horizline");
$MYSTOPLINE.name=mystopline;
$MYSTOPLINE.price=$montage.Price;
$MYSTOPLINE.Visible=1;
$MYSTOPLINE.color="255,255,0";
$MYSTOPLINE.labelbgcolor="255,0,255";
$MYSTOPLINE.save();
$MYSTOPLINE.showobject();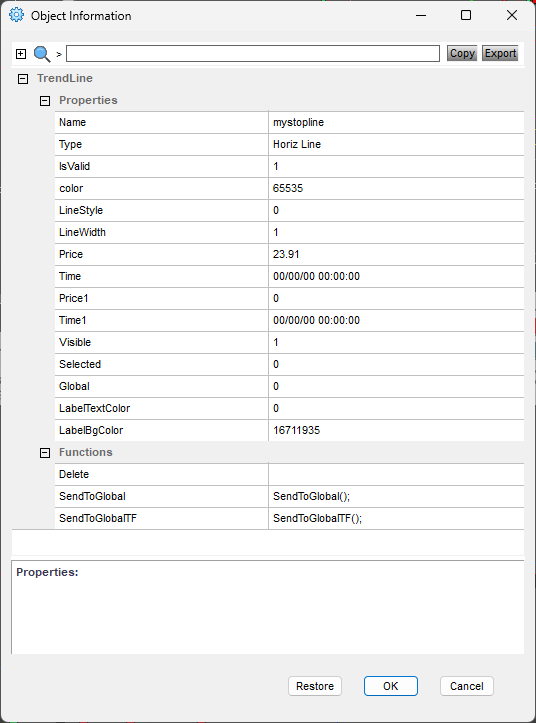
Use the line as a stop loss definition
To use the line as a stop loss, we need some scripts:
a button to enable the functionality
a script to determine line value and call the alert creation
alert cleanup script
monitoring of the line price change event
The functionality trigger button
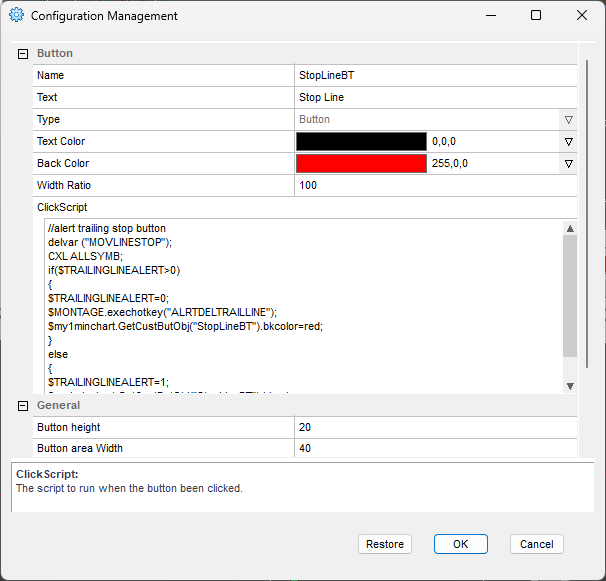
Let’s create a button. If you want its color to be changed based on its value, it has to be the new style window button, not a montage hot button.
Code for the button
Keep reading with a 7-day free trial
Subscribe to Peter’s Substack to keep reading this post and get 7 days of free access to the full post archives.