


DAS Trader Pro Advanced Hotkeys part 46
Timed messages on the chart

Have you ever needed to display a note for a short time on the chart? It can be something instead of the message box which takes over the focus and requires clicking on OK.
Sometimes you just need to display something for a while then make it disappear. Here is an example and a way how to do it.
I will use the technique from the previous post but this time with a timer removing the message.
Let’s say we need to:
Display the float for 3 seconds on a ticker once you select it
We need to split it into more steps and functions.
function to draw the text into the chart
function to call the draw of the text only once
function to delete the float after 5 seconds
Preparation step is to set the design of the text line, use the text line object manually just once. I also expect that you are familiar with naming the montage and chart windows and get the object variables as this is a general practice for over a year now.

Draw a text line to the chart

Right-click the object you have drawn and choose config

Here set your desired coloring, not much else can be changed
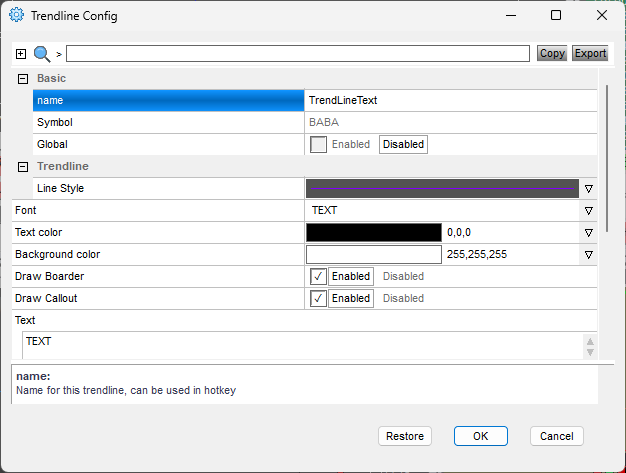
Delete the object from your chart afterward.
Keep reading with a 7-day free trial
Subscribe to Peter’s Substack to keep reading this post and get 7 days of free access to the full post archives.