This one will be a bit longer than others as it requires some new techniques I discovered in DAS Trader Pro. It took me several weeks of thinking and testing and DAS Trader crashing, but I was missing such a tool so much that I just had to do it.
The goal
I need a tool that would help me find support or resistance levels on a chart. That level us usually a bounce point visible as a big shadow of a longer time-frame candle.
It shall draw me the line where the level is automatically.
It shall be different color for support and different color for resistance levels.
Other requirements
To filter out very small candles or candles not having a shadow
It shall take into consideration only candles that are significant in size
It shall take into consideration only candles that have a shadow (also called a wick)
It should be tunable, so I can play with the thresholds and tunables
The thresholds and tunables
I can decide what size of the shadow is to be taken into consideration
I can decide what candle size is to be taken into consideration
I can decide how similar the tops or bottoms should to be, to be considered as a level
I can decide how many common tops or bottoms there need to be for the line to be drawn
I can decide how many candles back to look at. Limit being 200 candles.
This is how it is supposed to look when tuned properly.
The logical process
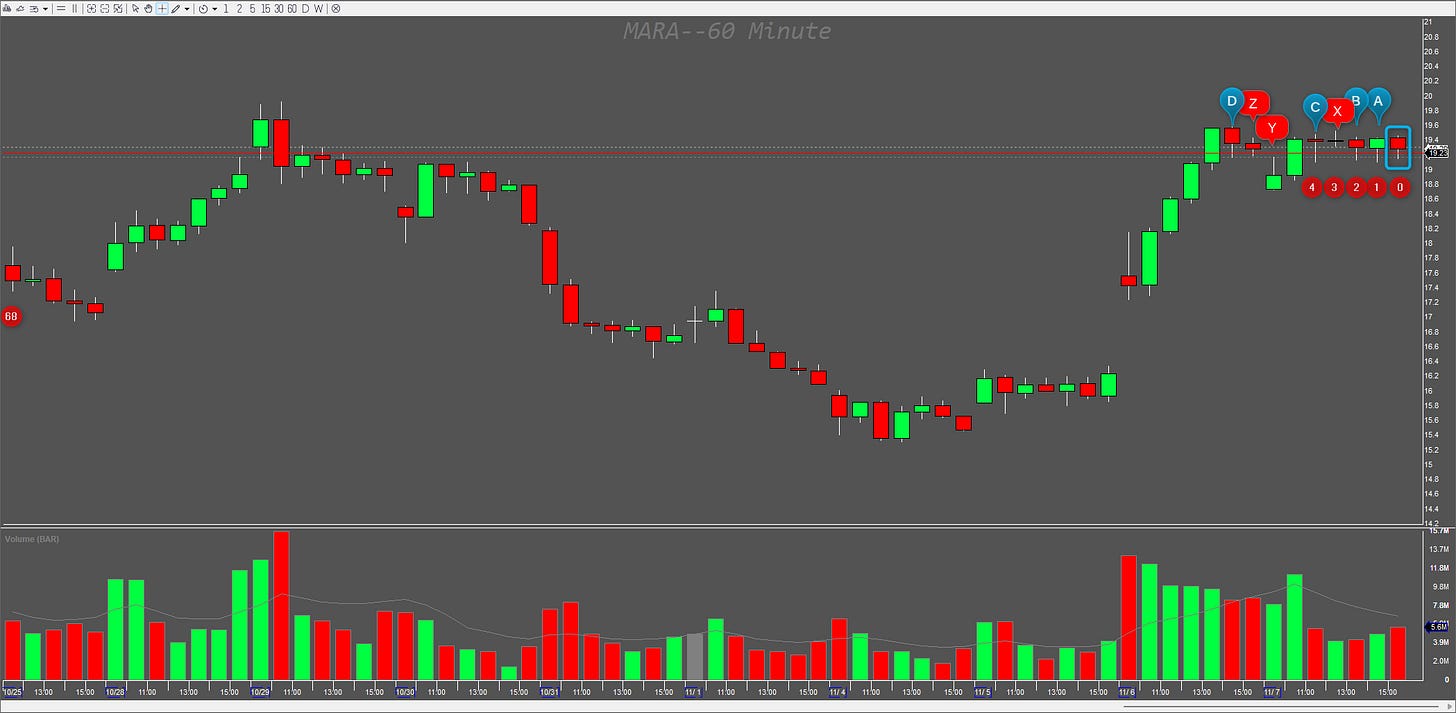
let’s take a clean 60-min chart of $MARA
Let’s say that we want to look 100 candles back and find support areas that are within 5 cents, on candles that created a bottom shadow. The shadow has to be at least 20% of the whole candle range, and the candle size has to be at least 25% of the daily ATR.
I take the first candle and determine if it is ok to be considered as per the above rules.
If yes, then I compare it with the other candles before
Candles A B C D would be considered because they have bottom wicks and are big enough.
Then, the candle bottoms will be measured
and if they are similar enough, they will be counted. If the counter reaches my desired number of candles found, I draw the line on the bottom of the candle that reached the similarity count and exit the finding process.
After that, the focus candle changes for the second candle
and the process of comparison is being repeated from candle 0 again.
At the end of this example, candle 68 is being tested against all the precedent candles and also all the following candles back to the number of 100
Requirements
DAS Trader Pro version 5.8.0.1 or later
$MYATR variable exists as explained in the previous article
Named chart window where we want to run the test. In my case, it is MY60MIN
Named hotkey for determining the candle shadows and candle sizes.
Hotkey or hot button that does the above logic
Make sure you have a hotkey for deleting all trend lines and all trendlines for all symbols ready
make sure that your trend lines config is DISABLED on Default global trendline
Hotkeys for the candle suitability test
Keep reading with a 7-day free trial
Subscribe to Peter’s Substack to keep reading this post and get 7 days of free access to the full post archives.


