

The camarilla pivot points strategies are quite popular. It can be quite challenging for new traders to remember all the rules on how to set the daily bias, which move to prepare for etc. Here is where DAS Trader advanced scripting comes to help. If you are not familiar with the topic, there are plenty of resources online explaining it, so I will not go into the basics here.
Huge thanks go to my fellow trading buddy Tomi from the BBT community, who helped me a lot with testing all this.
The goals of this proof of concept
the goals are
to prove that we can calculate own indicators
use the custom user objects to store the values
to improve the efficiency when scanning for stocks in play
to improve the efficiency when adding alerts for certain pivot level breaks
Calculate the camarilla pivot points.
AS the DAS very own page says, the calculations of the indicators are as follows:
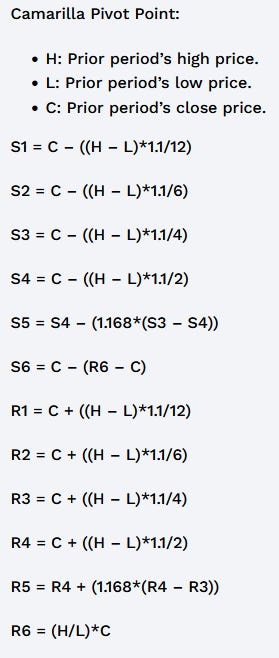
Let’s put that into the script syntax and store the values in a custom object for easier retrieval.
Requirements
The version 5.8.0.2 quite broke my go through the watch list mechanism due to a bug (I believe), so I recommend doing this in version 5.8.0.1 until fixed.
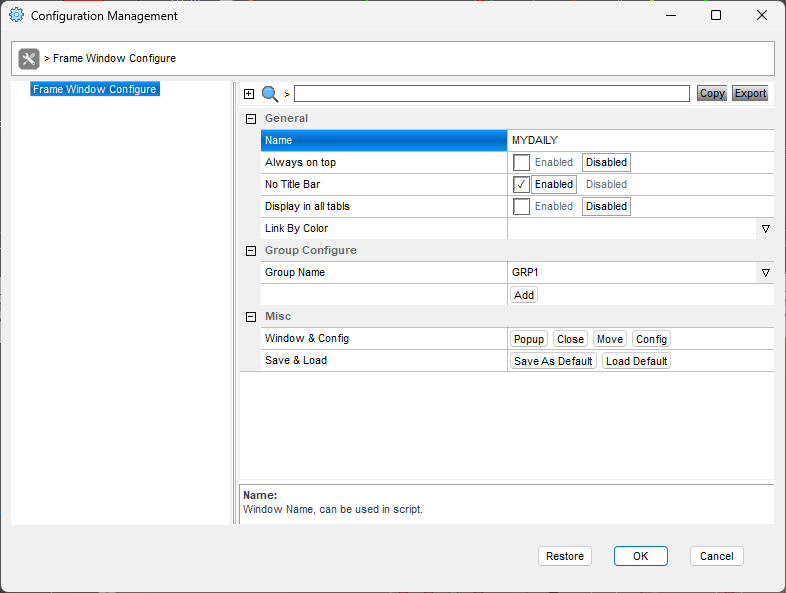
named window of the daily chart - MYDAILY
named montage window - MONTAGE1
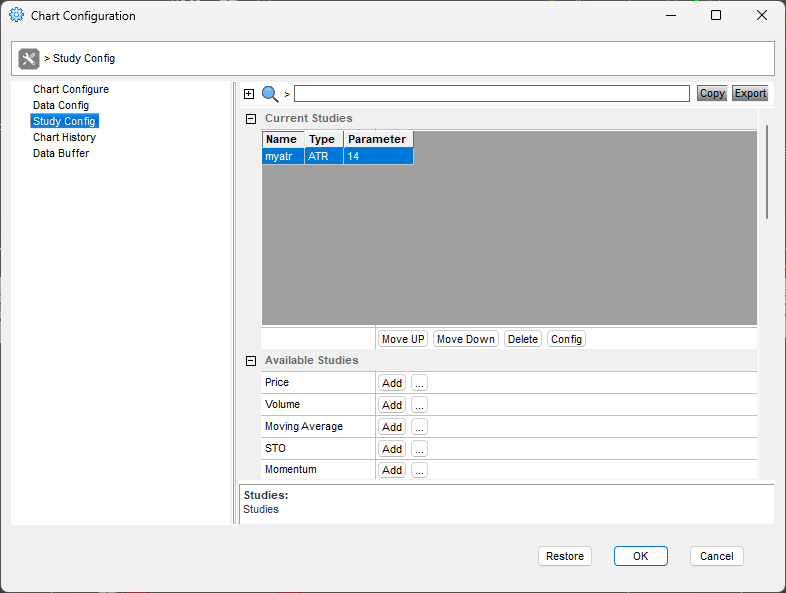
named ATR study - MYATR in a named window - can be the MYDAILY or special window as I do MYATRCHART
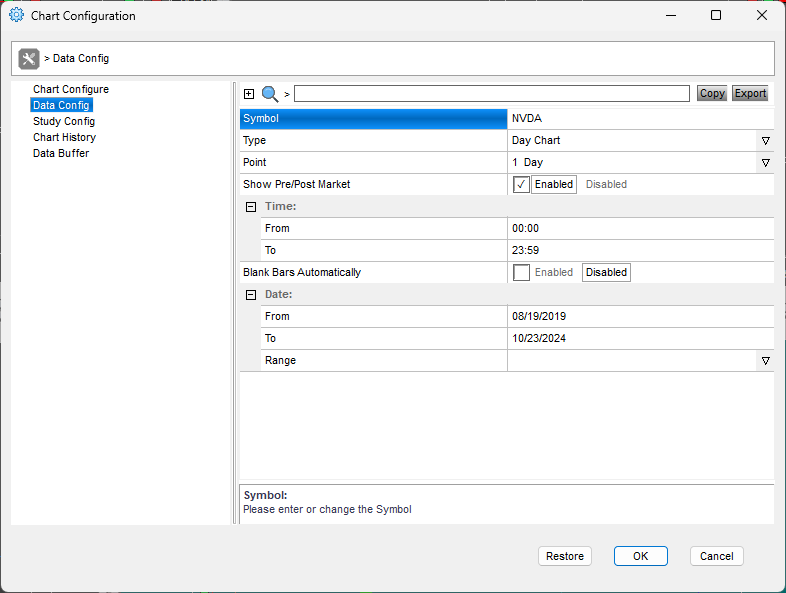
daily chart has to use show pre/post market data


The limits
we can calculate based on the daily chart only camarilla pivots without pre-market and post-market data. Read further for the camarilla pivot points with pre-market and post-market data.
$YCDL=getwindowobj("MYDAILY").getbar(-1);
//$YCDL.showobject();
$H=$YCDL.Hi;
$L=$YCDL.Lo;
$C=$YCDL.Close;
$P=($H+$L+$C)/3;
$CAMS=NewUserObj("CamsWOppmkt");
$CAMS.Symbol=SYMB;
$CAMS.Type="Without pre/post market data";
$CAMS.R1=$C+(($H-$L)*1.1/12);
$CAMS.R2=$C+(($H-$L)*1.1/6);
$CAMS.R3=$C+(($H-$L)*1.1/4);
$CAMS.R4=$C+(($H-$L)*1.1/2);
$CAMS.R5=$CAMS.R4+(1.168*($CAMS.R4-$CAMS.R3));
$CAMS.R6=($H/$L)*$C;
$CAMS.S1=$C-(($H-$L)*1.1/12);
$CAMS.S2=$C-(($H-$L)*1.1/6);
$CAMS.S3=$C-(($H-$L)*1.1/4);
$CAMS.S4=$C-(($H-$L)*1.1/2);
$CAMS.S5=$CAMS.S4-(1.168*($CAMS.S3-$CAMS.S4));
$CAMS.S6=$C-($CAMS.R6-$C);
We are storing them as an object, which will make our life easier with the variable management.
Determine the pivot points ranges
Keep reading with a 7-day free trial
Subscribe to Peter’s Substack to keep reading this post and get 7 days of free access to the full post archives.